What is a KPI & How to Use it to Scale Your Business?

In this guide, learn how to choose the right KPIs relevant to your business goals and speed up your KPI reporting with three quick steps.
- What is a KPI?
- How to Define a KPI?
- 4 Types of KPIs (with Templates)
- - Social Media KPIs + Template
- - SEO KPIs + Template
- - Digital Marketing KPIs + Template
- - PPC KPIs + Template
- How to Create KPI Reports with DashThis?
- KPI Reporting Made Easy
What is a KPI?
A KPI, which stands for key performance indicator, is a quantifiable measure that evaluates a business performance within a time frame.
Here’s a KPI report that measures a company's SEO and PPC performance in February 2022 to illustrate what we mean.

Grab this KPI dashboard with your own data!
Common examples of KPIs include:
- Employee satisfaction to boost engagement and retain top talent in HR initiatives
- Sales-qualified leads to identify leads most likely to close (often tracked with other sales KPIs like volume of new opportunities and customer retention rate by the sales team)
- Customer acquisition cost to measure growth from marketing campaigns like paid ads (e.g., PPC, Facebook Ads)
- Gross profit to assess a company’s financial health (often tracked with other financial KPIs like cash flow, net profit margin, and market share)
Discover more examples of KPIs in our growing list here.
How to Define a KPI?
Your KPIs will depend on a myriad of factors, including your strategic goals, business methodology, and growth stage.
For example, an agency that aims to produce top-ranking content for mid-stage product-led growth startups will focus on product metrics like:
- Number of product-qualified leads
- Customer lifetime value
- Customer satisfaction
It’d be a disaster for the agency to chase after pre-product market fit metrics like brand awareness.
The best KPIs will also tick the following boxes:
- Accountability: Shared metrics keep everyone accountable. Track progress with a few clicks using a KPI reporting tool like DashThis.
- Attainable: Overambitious goals set a company’s performance up for failure. Use KPIs that push benchmarks but are also within your limits—that’s the sweet spot.
- Automation-powered: Give stakeholders real-time access to the KPI reports. Automate your email dispatch to speed up decision making.
On DashThis, set the frequency and time period of the client’s KPI report and manage all scheduled email dispatches without leaving the platform.
- Click Sharing Options
- Select Share by Email
- Choose Dashboard Period
- Set frequency and enter remaining info (e.g., additional notes)
- Click Save

After you send the report, clients will receive an email inviting them to open it in view mode.
Start your free 15-day trial today.
4 Types of KPIs (with Templates)
Social Media KPIs + Template
The social media playground is a powerful tool for targeting an untapped audience. Track these KPIs to ensure that you’re heading in the right direction.
- Impressions: Measure the number of times your content is displayed, clicked or not
- Top posts: Monitor a list of your best-performing posts by reach, engagement, likes, or comments
- Engagement rate: Measure the average number of interactions posts receive from each user
Note the Instagram Insights report that breaks down the engagement rate by post type, time period, and hashtags.

Grab this Instagram Insights report with your own data!
These KPIs are crucial in content creation.
If you want to reach more people using hashtags, you could analyze the Top hashtags by Engagement widget to decide which trending or alternative hashtags are worth focusing on.
SEO KPIs + Template
There's nothing more valuable than holding the top spot on the SERPs in the marketing world.
Focus on these KPIs in your SEO tracking.
- Backlinks: Track the number of inbound links that link to your site or page
- Domain authority: Measure a website score based on the number and quality of backlinks
- Keyword difficulty: Assess the difficulty of ranking a piece of content on Google for a keyword
Here’s an Ahrefs report that shows the domain authority (note the “123” scorecard) and other vital site information.

Grab this SEO & backlinks report with your own data!
SEO beats short-term marketing tactics by a mile.
The next time you have a specific goal in mind, review your SEO KPIs report. It’ll help you identify your most profitable keywords, high-performing posts or pages, and review what else needs to be to bump up your rankings.
Digital Marketing KPIs + Template
If there’s one thing the pandemic has taught us, it’s this:
Digital marketing has helped businesses around the world target more online customers.
Let’s see how you fare with these KPIs.
- Bounce rate: Track the percentage of single page-sessions on a website
- Traffic sources: Identify which sources are sending traffic to a website
- Top pages: View the most popular pages on a site
Note the digital marketing report that shows a bird’s-eye view of your online presence.

Grab this digital marketing report with your own data!
PPC KPIs + Template
PPC is one of the most expensive marketing channels. Get the most out of your budget and optimize your business objectives with these three essential KPIs.
- ROAS: Track how much revenue was generated from an ad or campaign
- Cost-per-acquisition: Monitor the total cost of a customer completing an action
- Conversion rate: Measure the percentage of web visitors to a website that completes an action (e.g., leads converting to new customers)
Here’s a PPC report that turns jumbled data into eye-catching and digestible graphics.

Grab this PPC report with your own data!
How to Create KPI reports with DashThis
Before analyzing the high-level KPIs to inform your next plan, you need to present them in a clear and digestible format (bonus if non-marketers can understand them at a single glance).
Here’s how you can do it on DashThis with three quick steps:
- Connect your favorite marketing tools
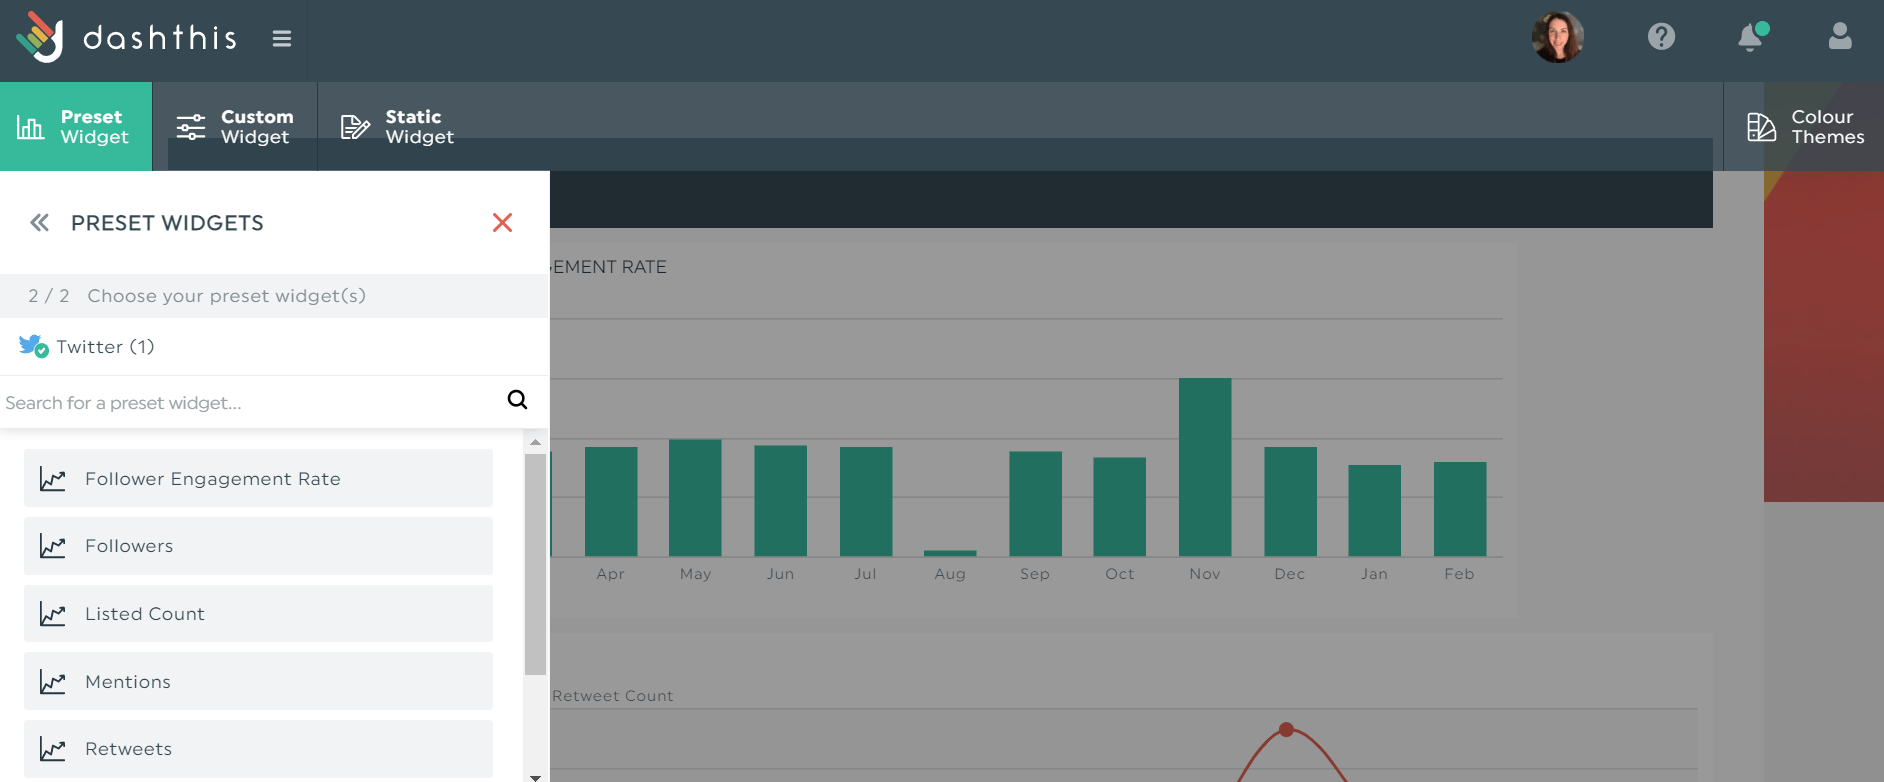
- Select your metrics from Preset Widgets
- Drag and drop them as you desire
Once clicked, DashThis will gather all relevant data and display them on your dashboard without any additional action from your end (assuming there's no need for customization!).
To customize the look of a widget, click Edit Widget > Data Display > Save.
Here’s how it might look when changing a curve graph to an area one.
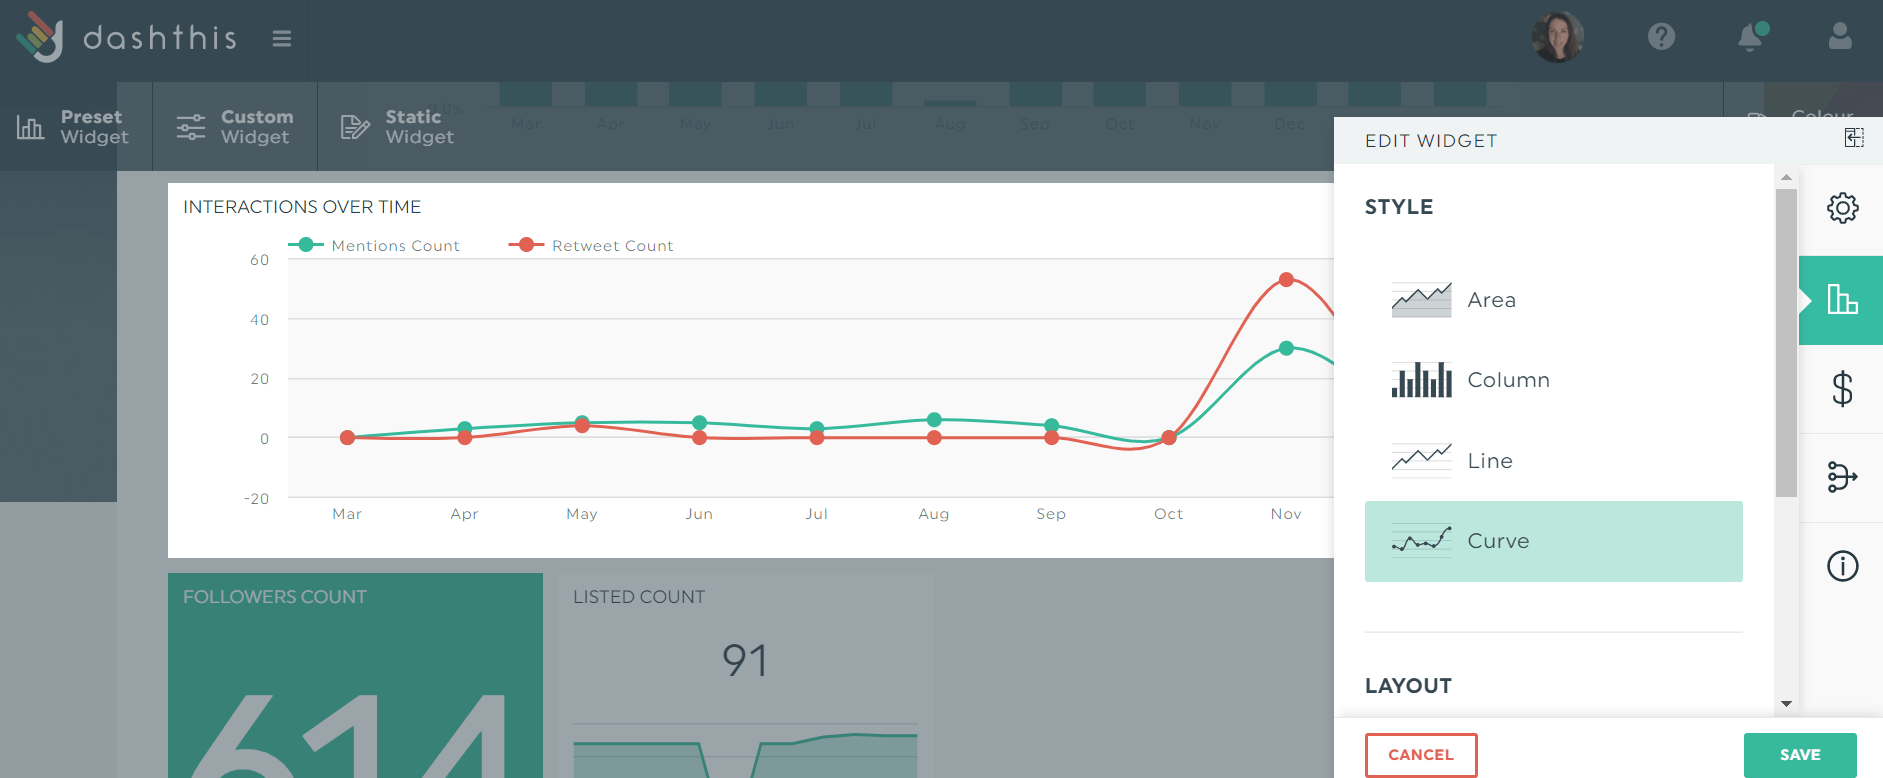
Change the color theme to reflect the client’s branding. Or add a note to explain a KPI’s erratic change and a comment box to share your insights and upcoming plans.
KPI Reporting Made Easy
The best KPIs keep you accountable and are attainable and automation-powered.
Set up your marketing KPIs according to your strategic objectives, business model, and growth stage.
DashThis works on a connect-and-forget mode. When you integrate your marketing tools, our reporting tool will automatically grab the relevant data from your desired channel without additional action on your part.
Your time as a marketer is precious. Start your free 15-day trial on DashThis to gain back hours of your time, simplify your KPI reporting, and impress clients today.

Ready to measure your KPIs and scale your business?
Read More

Don’t miss out!
Follow us on social media to stay tuned!
Automate your reports!
Bring all your marketing data into one automated report.
Try dashthis for free