TL;DR
YouTube metrics are the quantitative data points that measure how your videos and channel perform. Out of dozens available in YouTube Studio, only about 12 truly matter, and they fall into four groups: reach, engagement, audience and revenue.
Track these consistently, benchmark them over time, and pull them into one automated report so you spend time acting on the data instead of collecting it.
There are dozens of numbers in YouTube Studio, and it is easy to drown in them. This guide cuts the list down to the 12 metrics that actually tell you whether your channel is growing, what each one means, how to read it, and how to report on it without spending your Monday morning copying numbers into a spreadsheet.
Quick-reference table: the 12 YouTube metrics
| Metric |
Group |
What it tells you |
Good sign |
| Views |
Reach |
How many times your videos were watched |
Trending up over time |
| Impressions |
Reach |
How often your thumbnails were shown |
Rising with CTR holding |
| Impressions click-through rate |
Reach |
% of impressions that became views |
~4–10% for most channels |
| Watch time |
Engagement |
Total minutes viewers spent watching |
Growing, drives recommendations |
| Average view duration |
Engagement |
Average length of each view |
High relative to video length |
| Average percentage viewed |
Engagement |
% of the video watched on average |
>50% is strong |
| Engagement (likes, comments, shares) |
Engagement |
How viewers interact |
Rising engagement rate |
| Subscribers |
Audience |
Net subscriber growth |
Steady net gains |
| Returning viewers |
Audience |
Loyalty and retention of your base |
Growing share of returners |
| Audience demographics |
Audience |
Who is watching (age, geo, device) |
Matches your target |
| RPM / CPM |
Revenue |
Revenue and ad cost per 1,000 views |
Stable or rising RP |
| Estimated revenue |
Revenue |
Total earnings across sources |
Growing with views |
What are YouTube metrics?
YouTube metrics are the quantitative data points, such as views, watch time, and average view duration, that measure how your videos and channel perform. They live in YouTube Studio under the Analytics tab and are the raw material for every decision you make about content, from which topics to double down on to which thumbnails to redesign.
Metrics vs. KPIs vs. analytics: what's the difference?
These three terms get used interchangeably, but they are not the same thing:
- Metrics are the individual measurements — views, watch time, CTR.
- KPIs (key performance indicators) are the specific metrics you have chosen to tie to a goal. If your goal is loyalty, "returning viewers" becomes a KPI.
- Analytics is the practice of collecting, reporting on, and interpreting those metrics to make decisions.
In short: every KPI is a metric, but not every metric is a KPI. This article covers the metrics. If you are ready to turn them into goals, see the DashThis guide to YouTube KPIs.
Reach metrics: is your content being seen?
1. Views

Views are the number of times your videos have been watched. It is the headline number, but on its own it is shallow — a spike in views means little if nobody stays to watch. Use it as a directional trend, not a scorecard.
2. Impressions

Impressions count how many times YouTube showed your thumbnails to potential viewers. Rising impressions mean YouTube is pushing your content; falling impressions often signal the algorithm has cooled on a video.
3. Impressions click-through rate (CTR)

CTR is the percentage of impressions that turned into views. It is the truest test of your titles and thumbnails. Most channels sit between 4% and 10%; if yours is lower, your packaging (not your content) is usually the problem.
Engagement metrics: are viewers actually watching?
4. Watch time
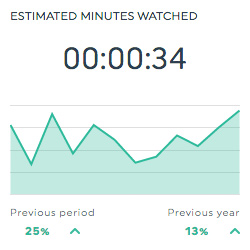
Watch time is the total number of minutes people have spent watching your content. It is arguably the single most important metric on YouTube, because the recommendation system rewards videos that keep people on the platform.
5. Average view duration

Average view duration is the average length of a single view. Read it alongside your video length: two minutes of average view duration is excellent on a three-minute video and poor on a twenty-minute one.
6. Average percentage viewed
This is the share of the video an average viewer watches. Anything above 50% is strong. Watch where the retention graph drops off — that timestamp is telling you exactly where you are losing people.

Likes, comments, and shares signal that viewers care enough to interact. Shares are the most valuable of the three because they bring in new audiences. Related paid metrics like video view rate matter here too if you run YouTube ads.
Stop pulling these numbers by hand
Copying watch time and CTR out of YouTube Studio every week gets old fast. DashThis pulls all 12 of these metrics into one automated dashboard so your reports build themselves.
Start a free DashThis trial
Audience metrics: who is watching, and do they come back?
8. Subscribers

Subscribers are your net follower growth over a period. Track the net number (gains minus losses) rather than the total, because a rising total can hide a churn problem underneath.
9. Returning viewers
Returning viewers measures how many people come back for more. A growing share of returning viewers is one of the healthiest signals a channel can have — it means you are building an audience, not just catching one-off traffic.
10. Audience demographics

Demographics tell you who is watching: age, gender, geography, and device. Use them to sanity-check that you are reaching the people you actually want to reach, and to inform everything from language to posting times.
Revenue metrics: what is your channel earning?
11. RPM and CPM
RPM (revenue per thousand views) is what you earn per 1,000 views across all revenue sources. CPM is what advertisers pay per 1,000 ad impressions. If you run ads, related cost metrics like cost per view (CPV) round out the picture. RPM is the number to watch because it reflects your actual take-home.
12. Estimated revenue

Estimated revenue is your total earnings from ads, memberships, Super Chat, and other sources. Pair it with views to understand how efficiently your audience converts into income.
How to track your YouTube metrics (step by step)
- Open YouTube Studio and go to the Analytics tab to see the raw numbers.
- Pick your 3–5 KPIs. Don't track all 12 with equal weight — choose the ones tied to your current goal (reach, engagement, loyalty, or revenue).
- Set a benchmark. Record where each metric stands today so you have something to measure progress against.
- Choose a reporting cadence — weekly for active channels, monthly for slower ones — and stick to it.
- Automate the report. Connect YouTube to DashThis so the numbers flow into one dashboard and you can automate your YouTube reporting instead of rebuilding a spreadsheet every time.
- Review and act. Each cycle, look for the one metric moving the wrong way and run one experiment to fix it.
Turn your metrics into a report
Metrics only pay off when someone reads them. Rather than screenshotting YouTube Studio, use a pre-built YouTube report template that lays out these 12 metrics in a clean, shareable format. If you also report on other channels, DashThis and other social media reporting tools let you combine YouTube with Instagram, TikTok, and the rest in a single dashboard, so stakeholders see the whole picture in one place.
YouTube report template
C-suites look at ROI when deciding if they want to continue investing in a marketing channel. Grab this YouTube report to show your hard-won results and get buy-in for the next video campaign.

Grab this YouTube report with your own data!
Social media report template
YouTube marketing is only one part of social media. Communicate how it contributes to your multi-channel strategy with this all-in-one report.

Grab this social media report with your data!
Frequently asked questions
What is the most important YouTube metric?
Watch time is generally the most important, because YouTube's recommendation system rewards videos that keep viewers on the platform. That said, the "most important" metric depends on your goal — CTR for discovery, returning viewers for loyalty, RPM for revenue.
What is a good CTR on YouTube?
Most channels see an impressions click-through rate between 4% and 10%. Below 4% usually means your titles and thumbnails need work; above 10% is strong.
What is the difference between YouTube metrics and KPIs?
Metrics are all the individual measurements available. KPIs are the specific metrics you have chosen to tie to a business goal. Every KPI is a metric, but not every metric is a KPI.
How often should I check my YouTube metrics?
Weekly for active channels, monthly for slower-moving ones. The key is consistency, so you are comparing like with like over time rather than reacting to daily noise.
What is a good average view duration?
Read it as a percentage of video length: an average percentage viewed above 50% is strong. The absolute minute count matters less than how much of the video people finish.
Can I track all my YouTube metrics automatically?
Yes. Tools like DashThis connect directly to your YouTube channel and pull every metric in this guide into one automated dashboard, so reports build themselves and update on schedule.
Report on all 12 metrics in minutes, not hours
You now know which YouTube metrics matter and what each one means. The last step is making them easy to report on. DashThis connects to YouTube and 30+ other marketing sources to build automated dashboards your whole team can read.
Try Dashthis for free
 The Team at DashThis
DashThis is the power behind thousands of reporting dashboards created by and delivered for agencies and digital marketers every month.