The Ultimate Guide on LinkedIn Analytics (Agencies Edition)

LinkedIn has had a bad rep as a professional social media platform over the years.
Blame it on the try-hard and cringey posts (remember that crying CEO selfie?).
But you have to admit, it is the most powerful professional network that helps you tap into a new top-tier audience—if you know how to use it correctly.
This guide outlines the top LinkedIn analytics you should track today and how you can get started on this often-misunderstood channel.
- What is LinkedIn Analytics?
- How to Make the Best of Your LinkedIn Analytics?
- Top LinkedIn KPIs to Track
- How to Create a LinkedIn Analytics Report?
What is LinkedIn Analytics?
LinkedIn analytics is a set of metrics that tells you how a LinkedIn profile or page performs across a time period.
Boasting over 850 million members globally, it is the most popular social network for professionals.
Note the LinkedIn Analytics dashboard below that stacks up a business page's number of followers against the engagement rate.

Grab this LinkedIn Analytics report with your own data!
These rich LinkedIn metrics help you spot trends and determine the best way to engage with your top-tier followers.
How to Make the Best of Your Linkedin Analytics?
Different goals, different moves.
Acquiring high-value leads from Linkedin Ads will require different strategies from say improving a career page’s engagement rate.
Before you start posting, ensure that you tick the following boxes.
(i) Create a strong LinkedIn strategy: LinkedIn’s algorithm prioritizes interactions, so get your team involved early on to improve your content reach. A strong social media marketing strategy on this #1 professional network requires high-impact content from both the company page and your employees' personal profile.
(ii) Track important metrics: Content optimization involves tracking important metrics and spotting patterns amongst the winners. Either use the built-in LinkedIn analytics tools (e.g., real-time campaign manager) or a third-party analytics platform like DashThis to automatically monitor your performance.

(iii) Analyze data and adjust accordingly: Perform a content analysis to evaluate what’s working and not. For instance, the ads and offers that got you your first 10 SMB leads might no longer work if you recently moved upmarket.
Unlike other marketing channels, promoting your business on LinkedIn—whether it’s building an email list for a lead generation campaign or increasing video views for an evergreen webinar—requires massive team effort across departments.
It’s not just marketers!
The more your employees get involved in spreading the word, the greater the reach and the bigger the ROI of your marketing efforts.
Top LinkedIn KPIs to Track
LinkedIn analytics works very much the same way as any other social channel.
The main thing you should know is that the professional networking platform divides its data into three major categories: follower metrics, update analytics, and visitor metrics.
Total follower count
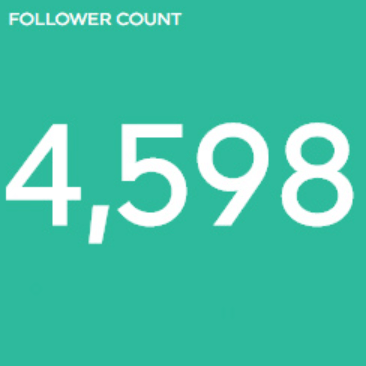
Total follower count shows the number of LinkedIn members following your LinkedIn company page.
The more followers you have, the greater the organic reach and likelihood you’ll attract customers.
Consider optimizing your page for SEO, participating in conversations with hashtags, and creating Showcases Pages for your different verticals to increase new followers.
Pro tip: Combine the total follower count across your different channels in a single widget to display the overall performance.
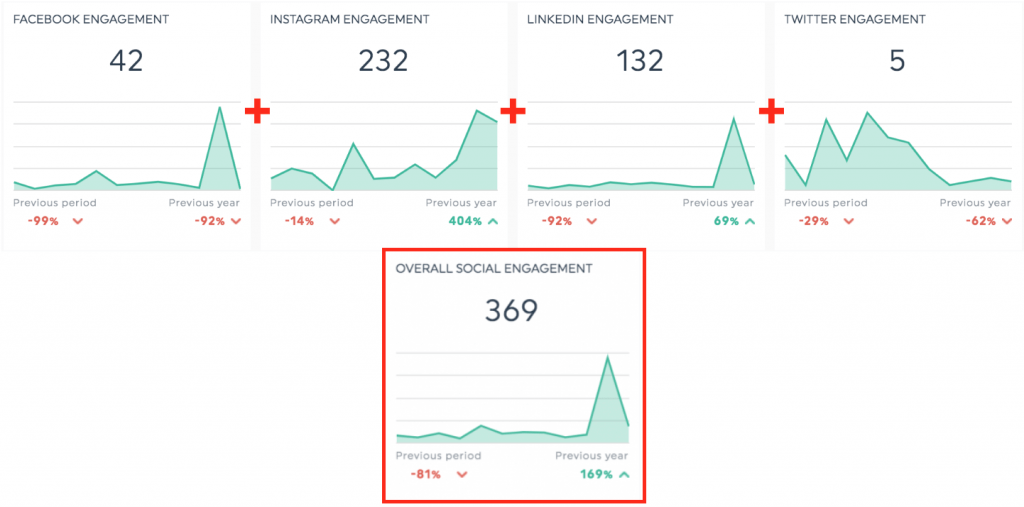
Locate the widget you want to merge and click Edit Widget > Merge Widgets. Select the metric you want to merge from the dropdown menu and click Save.
Follower demographics
Follower demographics shows you a breakdown of the members following your page, along with their vital details such as company size, job function, and seniority.
(Note: Not to be confused with visitor demographics, which shows you the members who visited your page, and unique visitors, which indicate individual members who visited your page).
This data is valuable, as it informs your content strategy and helps you understand the best way to engage with members. For example, if C-suites make up your target audience, focus on creating thought leadership content instead of low-impact listicles.
You can share these content marketing strategies within the report. Click Static Widget > Comments > Save.
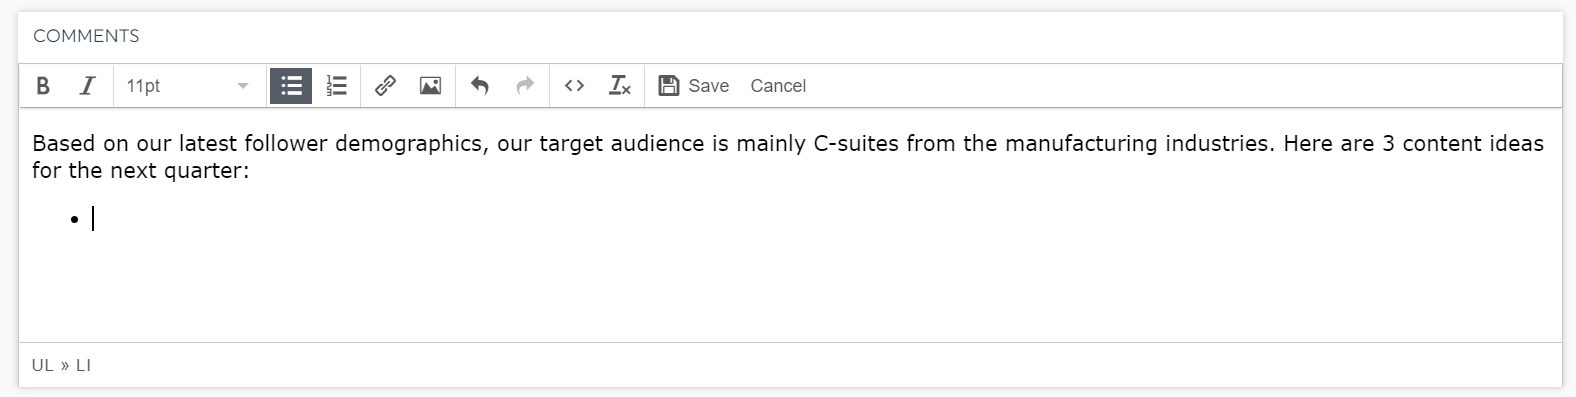
This saves you the hassle of sending a separate email with your recommendations.
Impressions

Impressions represents the number of times your LinkedIn updates are shown for at least 300 milliseconds with at least 50% in view.
On the other hand, unique impressions refers to the number of times said updates are shown to individual members.
This metric is important because it helps you gauge the quality of your LinkedIn posts and improve accordingly.
Tip: Measure impressions alongside click-through rate (CTR) to determine the effectiveness of your copy.
Top posts (reach)
Top posts (reach) represents a list of your top-performing LinkedIn posts, measured by the number of likes they received.
Track this metric to determine the content type or themes that resonate with your audience and double down on it.

DashThis lists your top LinkedIn posts based on the engagement rate, likes, and clicks
Pro tip: If you’ve enlisted employees to promote your page’s posts, remember to review their profile analytics to gain insights into their performance.
Page views

Page views displays the total number of times your LinkedIn page has been viewed.
It’s one of the most critical metrics that evaluates your page performance.
How to Create a LinkedIn Analytics Dashboard?
Cobbling together a set of metrics, especially when you work with dozens of channels and clients simultaneously, takes up a lot of time.
Gain back hours of your time from reporting with an automated marketing reporting tool like DashThis.
All you have to do is connect your data sources only once and our tool will automatically grab all data from your different channels into one beautiful report.
Here’s how it works:
- Select the LinkedIn Business Report template
- Connect your LinkedIn account with DashThis
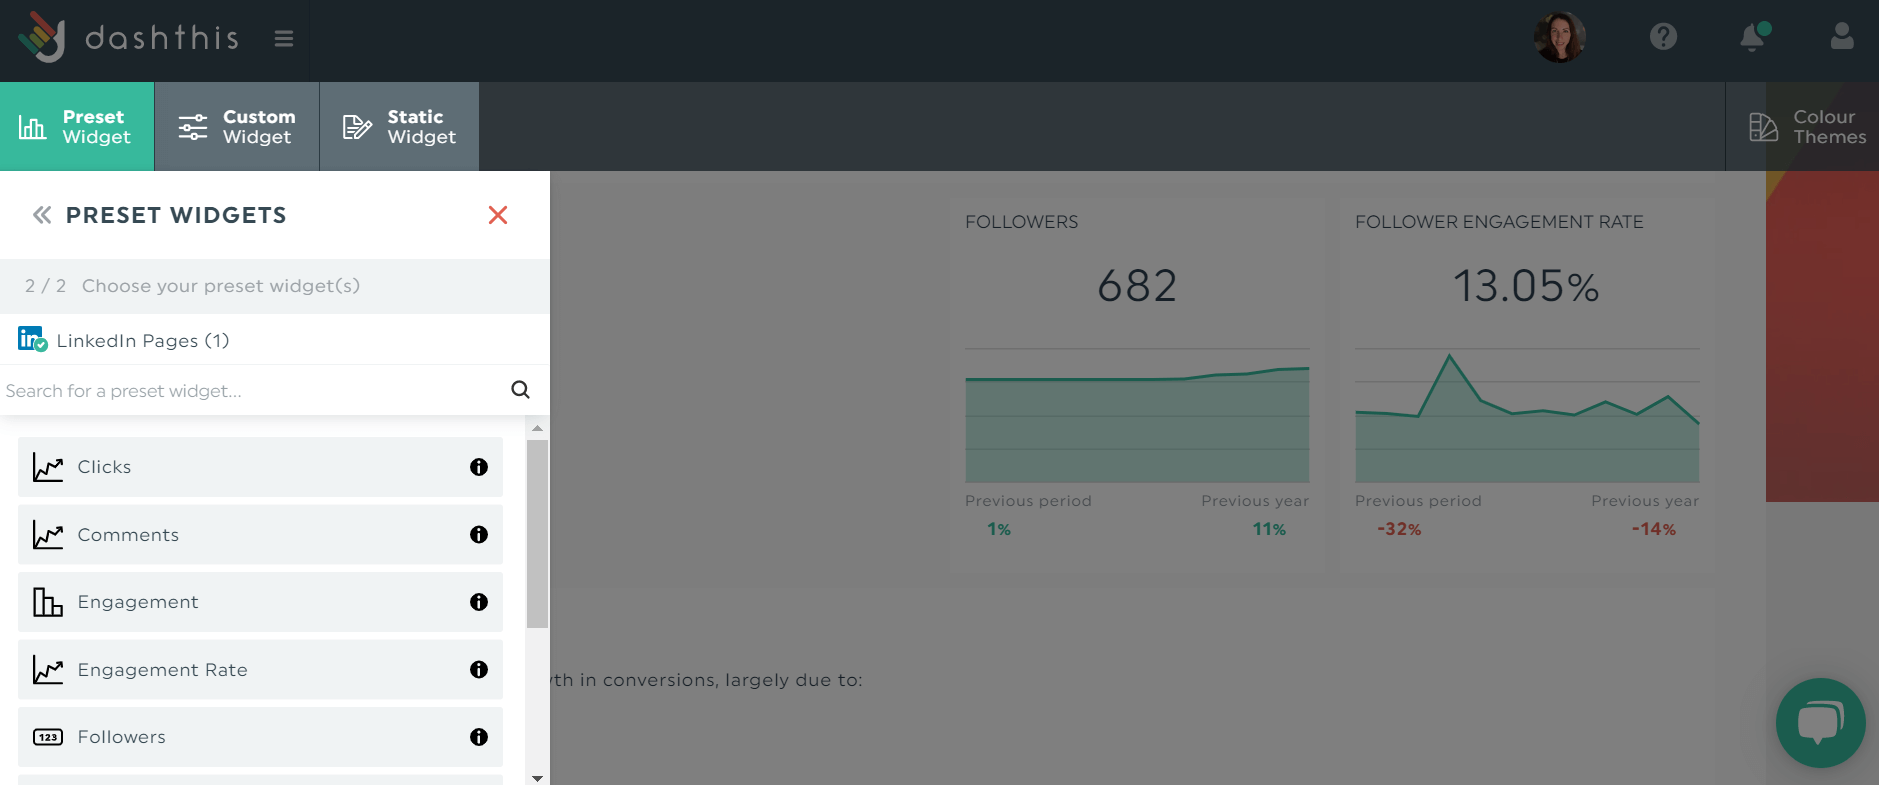
- Pick your metrics in Preset Widgets
Drag and drop the page analytics as you desire to form a cohesive look.
All widgets include contextual hints, so you don’t need to worry about tracking the wrong data. Click the information icon to learn what each metric does.
Once you’ve finished creating your report, send it to all stakeholders.
Either share it via a shareable URL link, email, or PDF. You can even automate your report distribution and grant real-time access.
Start your free 15-day trial of DashThis today to create your LinkedIn analytics report in the blink of an eye.

Ready to track your LinkedIn KPIs and metrics?
Read More

Don’t miss out!
Follow us on social media to stay tuned!
Automate your reports!
Bring all your marketing data into one automated report.
Try dashthis for free