Dynamic reporting: tips for effective reports (template & examples)

Dynamic and static aren’t only terms that apply to metaphors, websites, or IP addresses; they also describe different reporting techniques.
We’ll show you the differences between static and dynamic reports and when to use which technique. Read on!
What is dynamic reporting?
Simply put, dynamic reporting is business information in real-time, accessed whenever you want.
Like how streaming services like Netflix and Disney+ provide you with a massive on-demand library of content for you to watch at your leisure through a centralized app, dynamic reports ensure you can access the most up-to-date version of your business metrics from anywhere as long you have an Internet connection.
Examples of dynamic reports:
Management reports:
Present all your key metrics to your company’s executives in one dashboard. This dynamic report allows executives to see essential details upfront while allowing the flexibility to compare and segment data points to answer any questions.

DashThis executive report template: See it with your own data.
Sales and marketing report:
Sales and marketing meetings usually have many moving parts; discussing upcoming campaigns and reviewing critical metrics on both sides. Dynamic reports work exceptionally well in these situations to capture rapidly changing data.

DashThis’s weekly sales report for e-commerce report template
What is static reporting?
In comparison, static reporting acts like a Polaroid camera. Just as photographs capture moments frozen in time, static reports offer a snapshot of a company’s historical performance and trends over a time period. They are your PowerPoint decks and PDF files – reports disconnected from the Internet and used for a specific presentation or distributed to a broader audience.
Once presented, static reports aren’t usually referred to again. They become part of a company’s archive.
Examples of static reporting:
Company annual or earnings call reports: These reports record company performance metrics, KPIs and milestones for the previous quarter or year. While yearly reports usually come in PDF documents and slide decks, especially for publicly listed companies, some companies use visuals and animation to make their static reports more vibrant. See Mailchimp’s 2020 annual report here for an example of how static reports can be made fun.

Market or brand performance analysis: Historical data is key to analyzing your company's performance relative to your competitors.
What are the main differences between static and dynamic reporting?
Real-time reports vs a snapshot of data:
Dynamic reports show data in real time, while static reports show a snapshot of previous events. This means people can review the data from multiple angles within a single web link to suit business needs.
Suppose you’re preparing an email marketing report for your client to answer these questions:
- How many subscribers did we add this month?
- How is our unsubscribe rate doing? Was it higher or lower than last month? Why is that?
- What content elements performed the best?
Using the static report approach, you'll need to create a custom report to answer these questions precisely. A dynamic report shows your latest statistics in real-time, which is especially useful for ongoing campaigns where metrics change rapidly.
Interactive vs what you see is what you get.
Data sets in dynamic reporting tools are interactive, thanks to AI and machine learning tools.
You can mouse over a graph to view more insights or attach a comment to add further analysis to a metric for deeper analysis and context.
Want to dig into a specific time frame, segment by campaign, or channel in your data analysis? Dynamic reports are self-service. You can adjust your date range or analysis parameters to get the answers you need without the back-and-forth of requesting another report.
Static reports, in comparison, have fixed functionality. You’ll need to edit your report data and save it as a new version to make any changes to the report. This makes static reports a better historical reference but less useful for quick decision-making.
3 advantages of dynamic reporting vs static reporting
It’s easier to review and make business decisions
It's essential for business owners to adapt to new trends, like identifying new revenue streams, as Spotify did by creating original podcast content or restaurants investing in food delivery services in 2020.
Dynamic reports make this decision-making process more manageable, as you’ll always have the most recent data on hand for data analysis. Users can interact with the data, dig into specific metrics and compare data across time periods for better business decisions – all from a single dashboard.
This means your CEO and heads of departments several cities away can click on the same link and see the latest data in real-time This process is more tedious with static reports, as you’ll need to export static data into the proper formats and share them digitally.
Templates are available to save time.
No need to be confronted with a blank page while preparing your report for your next reporting deadline.
Customizable dynamic reporting templates in reporting software are an easy and practical way to save valuable time while ensuring nothing important gets left out of your report.
When creating dozens of monthly reports, these time savings add up quickly, making you more effective at your job.

DashThis’s digital marketing report template with all the essential performance metrics you need to build valuable reports that are easy on the eye.
Simplifies communication and project management
Suppose your client or stakeholder has a question about your latest report.
If you’ve sent your report in a static PDF format, they might ask a question beyond what your data set is showing, and you’ll need to manually generate a new data set with the parameters to answer their question.
The process works, but it’s tedious. The risk of making mistakes increase, and it takes up time.
Dynamic reports improve this process.
If your customers have a question about the data, they can go into the link to the dynamic report you’ve created and play around with the data to find their answers. By giving your customers or stakeholders more control, they will be able to see how your campaigns are performing and where their budget is going, thus making your relationship more transparent.
How to create a dynamic report people want to read:
Determine your objective and select your metrics
Just with any written piece of communication, you’ll want to know your overall goals and the purpose of the dynamic report. This will help you structure your report for maximum effectiveness.
Some questions to ask yourself to get started:
- What does this report want to show?
- Who is reading this report?
- What metrics do they and their superiors care about?
- How do I gather the data I need to populate the report?
Don’t overstay your welcome:
Venture capitalist Guy Kawasaki has a rule he applies to any PowerPoint presentation, the 10/20/30 rule.
A PowerPoint presentation should have 10 slides, last no more than 20 minutes, and contain no font smaller than 30 points.
You may not be presenting PowerPoint reports here, but keep this guideline in mind while preparing your business intelligence reports. There’s a limit to how much information people can absorb before losing focus.
Keep a dynamic report to a maximum of 10-15 metrics, make sure every metric is relevant to your objective and have a structure that supports the points you’re trying to communicate.
Use interactive data visualizations:
Interactive features get your reader involved in the data. It’s also a more effective way to present any form of analytics to your end-user.
Thankfully, dynamic reports are where interactive data thrive.
Take your text-based reports further with responsive widgets. Want to compare your Google Ads performance to last month or the year before? You (and the people viewing your report) can easily do that with a few clicks, saving you time and enabling better data-driven decisions.

Use charts, graphs and gauges to present your data and make it easier to understand than boring ol’ Microsoft Excel spreadsheets.
Speed up your reporting with an automated reporting tool
The time you spend exporting and cleaning data, converting your data into the right formats, and figuring out visuals is time you can spend elsewhere.
Automate the entire process with a data integration tool that pulls in your information from all your tools, selects your metrics, and creates a template you can reuse.
How to create (and automate) a dynamic report with DashThis
Step 1: Sign up for an account with DashThis. Our free 15-day trial allows you to see if we're the right fit for you.
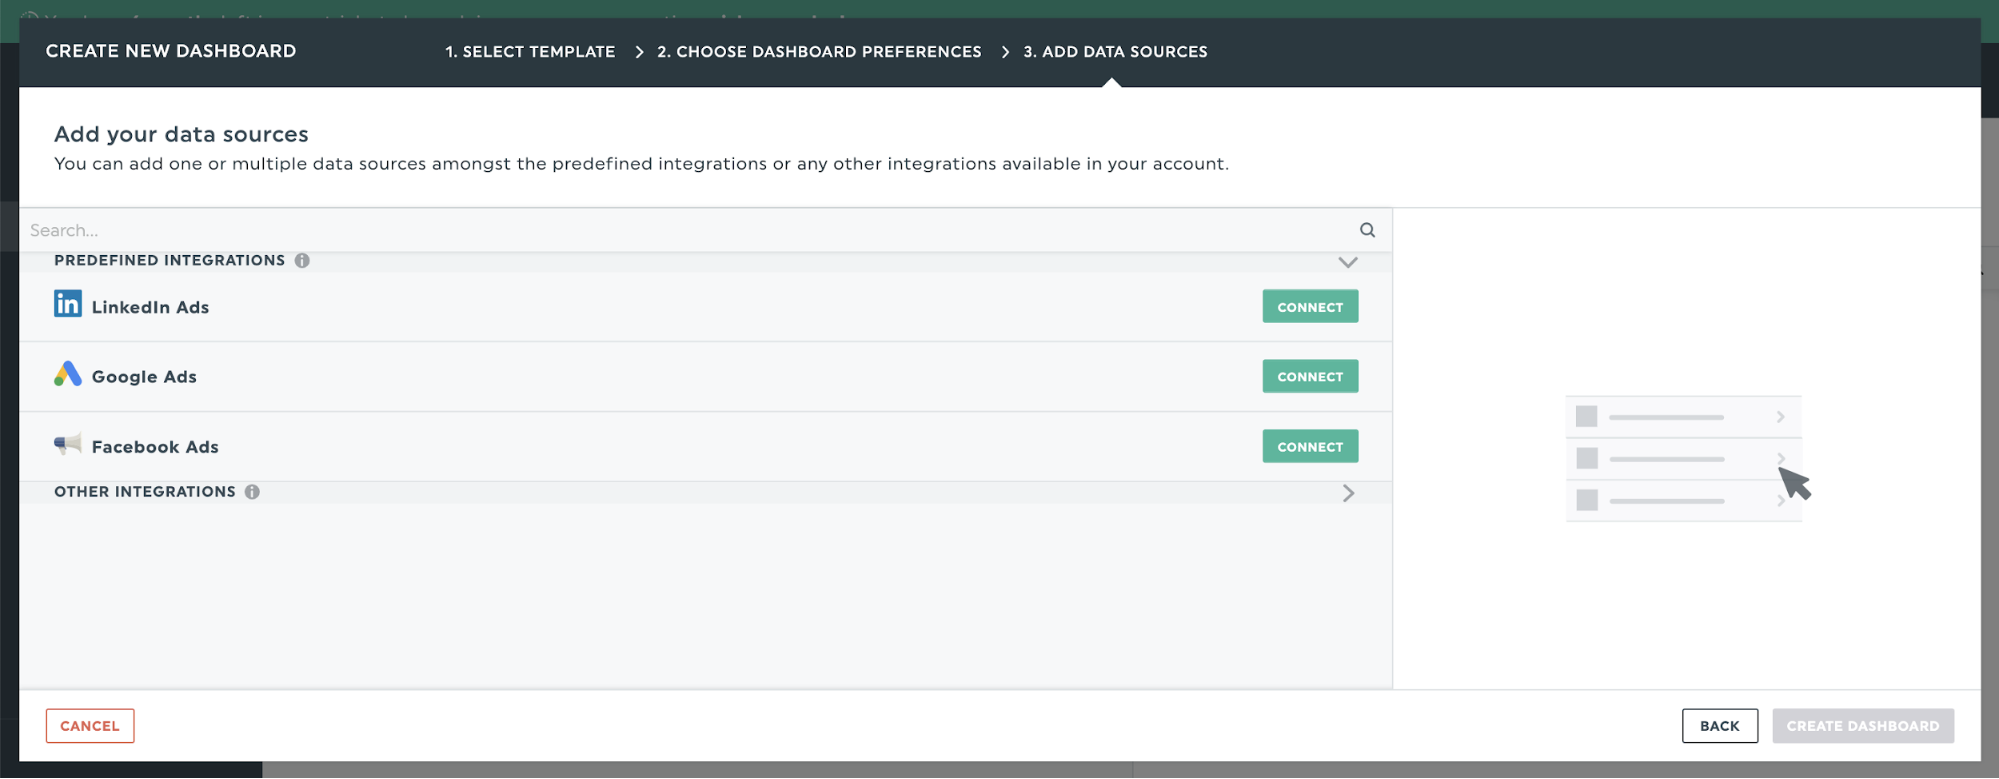
Step 2: Choose from over 40+ integrations and connect your marketing tools and data sources in seconds.
Step 3: Select the metrics to include in your report from DashThis’ preset widgets.
Step 4: Add as many data points as you need to set up your report. Once done, save your completed report as a template so you can reuse the template for future monthly reports and clients - saving even more time!
Bonus time-saving tip: Automatically schedule to send your report through email. Just enter the recipients' email addresses you want to send your report, and you’re done!

Ready to create your report?
Read More

Don’t miss out!
Follow us on social media to stay tuned!
Automate your reports!
Bring all your marketing data into one automated report.
Try dashthis for free