How to Use KPI Monitoring to Scale Your Business

It’s impossible to know what’s happening in a business without KPI monitoring.
So this begs the question: What KPIs should you be monitoring to ensure that you’re starting on the right foot?
In this guide, you’ll learn the business metrics that you can’t go wrong with and how you can speed up your monitoring within minutes.
- What is KPI Monitoring?
- What KPIs Should You Monitor?
- - Social Media KPIs
- - SEO KPIs
- - Sales KPIs
- How to Monitor Your KPIs?
- Start Your Free 15-Day Trial on DashThis Today
What is KPI Monitoring?
KPI monitoring tracks your most important metrics and points you in the right direction of your business goals, ensuring that you:
- Meet and exceed your target, whether it’s increasing the number of paid monthly subscriptions or improving business processes
- Identify the best practices unique to your business, such as the best-performing marketing channels and the type of content that wins heart, minds, and sales from new customers
- Optimize the ROI of your marketing efforts to improve future campaigns, replicate their success, and generate massive profits
Here’s a hotel marketing report that automatically grabs several performance metrics from Google Ads, Google Analytics, and Facebook. Note how each metric plays a role in the booking revenue (i.e., the KPI) during the one-month time frame.

Grab this hotel marketing report with your own data!
Google Data Studio and spreadsheets like Excel overcomplicate KPI monitoring, especially when you’re new to the strategy side and working with clients without expertise.
Reporting tools like DashThis track KPIs across multiple channels and turn overwhelming data into digestible visuals in a few quick clicks.
Start your 15-day free trial with DashThis today to automate reporting and analyze results with stakeholders at a glance.
What KPIs Should You Monitor?
If you’re feeling out of depth on choosing the metrics that make up your KPI, don’t worry. All dashboards on DashThis include the most commonly used data points. Make a judgment call to see which KPI examples apply to your business and track them accordingly.
Social Media KPIs
Social media is unlikely to drive sales on its own. But when you use it with other channels, such as SEO, it attracts massive sales.
To make this happen, you need an engaged audience. High impressions, likes, and followers add up to exposure and sales numbers—you know, all the good stuff. And there’s no better way to measure them using these data points:
- Page likes and followers
- Social media engagement rate
- Reach and impressions
In your dashboard reporting software, combine organic and paid social metrics for an integrated strategy. Here’s a KPI report that marries Facebook Insights and Facebook Ads.

Grab this social media report template with your own data!
Notice how each channel feeds off the other?
If you find it challenging to guide clients on the role of inbound and outbound marketing, explain how both processes impact their growth strategy on DashThis.
Click Add Note to provide context for each metric and click Save.

This helps clients get more value out of your report.
Use the Notes widget to educate busy clients about their multi-channel marketing campaigns, how their results stack against the industry’s benchmark, and what’s attainable and not in the next action plan.
SEO KPIs
It takes a long time to establish a competitive advantage and attract quality leads in SEO.
Thousands of websites are vying for your audience’s attention with “copycat content”—all the more reason to go against the grain in your content strategy!
Combine your favorite SEO tool with Google Analytics to start on your best foot:
- Website traffic
- Landing page visits
- Bounce rate
- Number of backlinks
- Number of referring domains
- Search engine ranking/position
Here’s a KPI dashboard that shows the correlation between your keywords and rankings on the SERPs.

Grab this SEO report template with your own data!
These powerful dashboards convey outcome-based goals at a glance.
For example, when you click Preset Widget, DashThis automatically pulls data from the selected channel and turns them into graphs. To edit them, click Edit Widget > Data Display > Save.
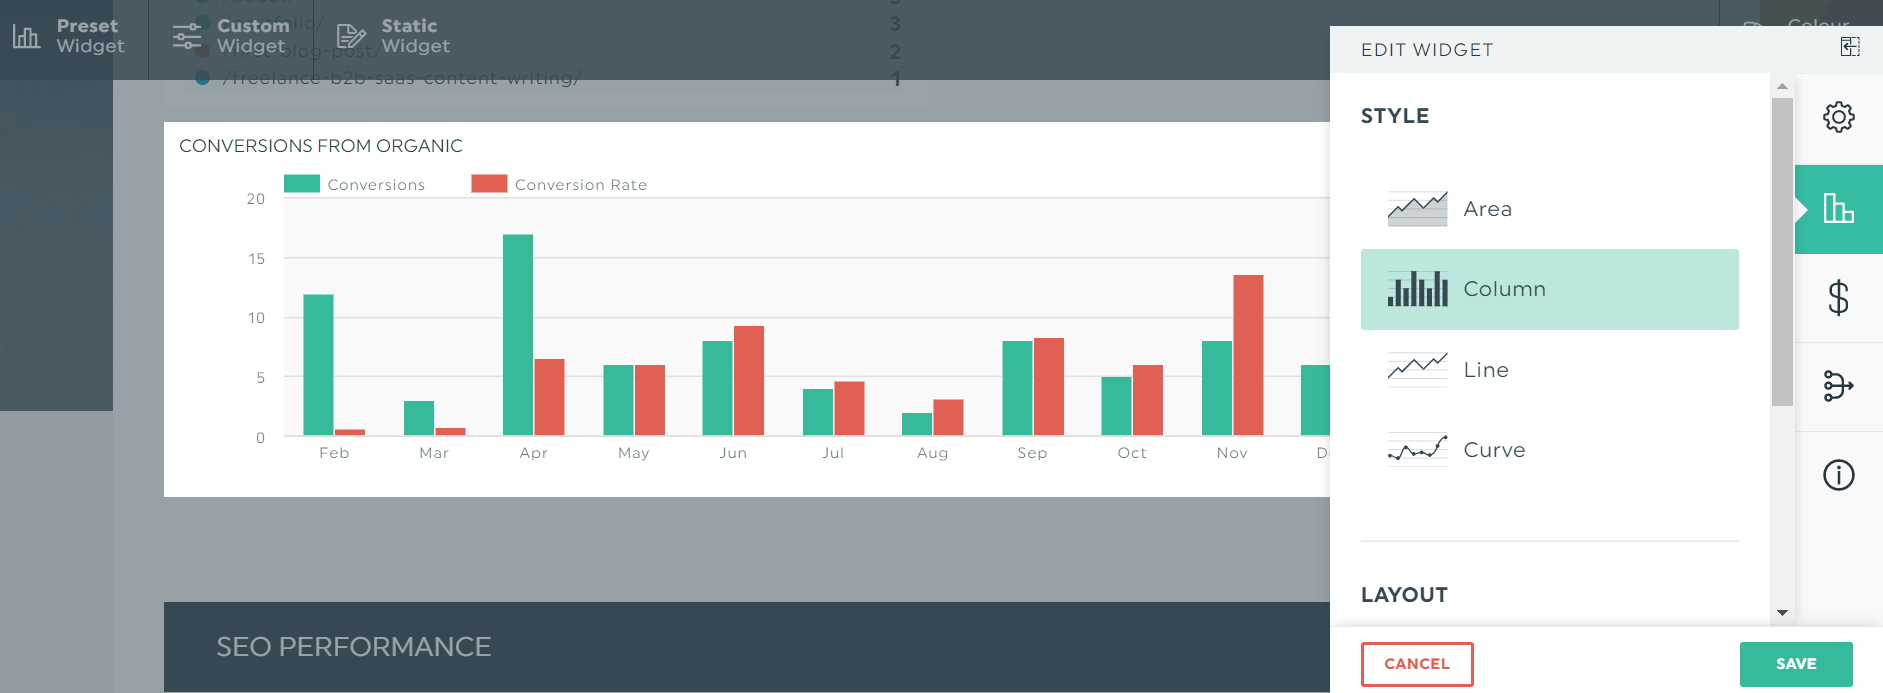
Pick your favorite style in this chart that compares conversions with conversion rate
Effective KPIs don’t just inform.
They tell a story.
Before implementing your new action plan, make your case to the client. You can do this quickly without leaving the reporting dashboard. Click Static Widget > Comments to share your insights in the editor.
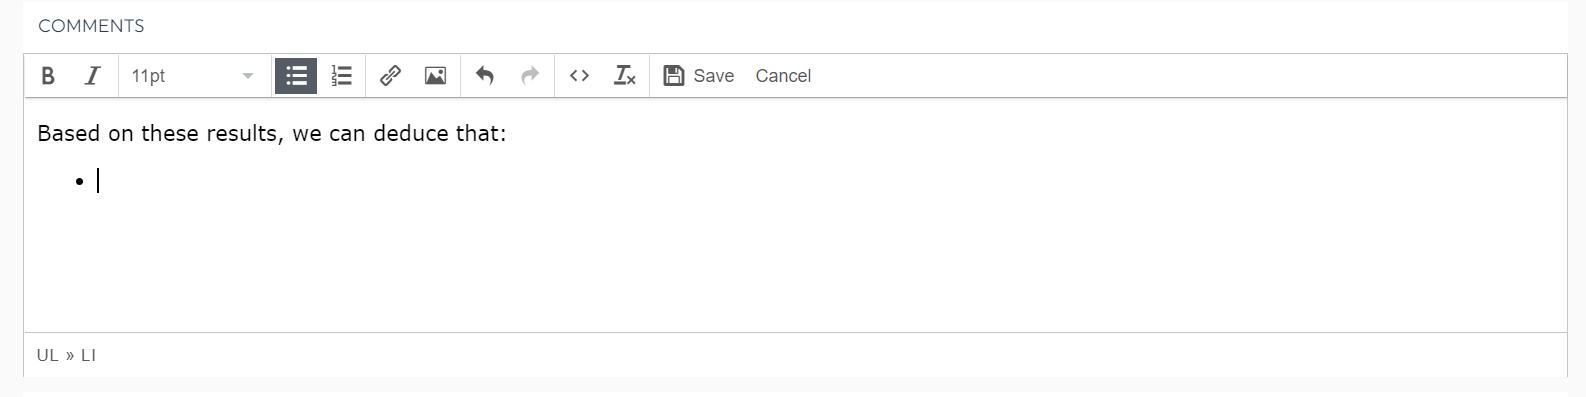
Whatever your recommendations, the performance data and high-level analysis within the dashboard guarantee a fuss-free reporting and decision making process.
Start your 15-day free trial with DashThis to simplify and speed up KPI monitoring today.
Sales KPIs
Marketers are no stranger to sales breathing down their neck and lamenting about low-quality leads.
To meet your business objectives, rally these two opposing teams to work on shared strategic goals. Better yet, rope in customer support and product. Once you align these different departments, you’ll see how achievable those lofty goals are.
Here are the financial KPIs worth tracking today:
- Profit margin
- Sales revenue
- Cost-per-transaction
- Cart abandonment rate
- Customer lifetime value
Below, you’ll see an ecommerce sales report that details everything you need to know about the company’s sales growth.

Grab this sales report template with your own data!
For instance, the new vs. returning users (not pictured) chart helps you gauge the effectiveness of the retention campaign.
How to Monitor Your KPIs?
KPI monitoring tools speed up the consolidation of data across multiple channels. In this section, you’ll see how quick and easy it is to track your KPIs using DashThis.
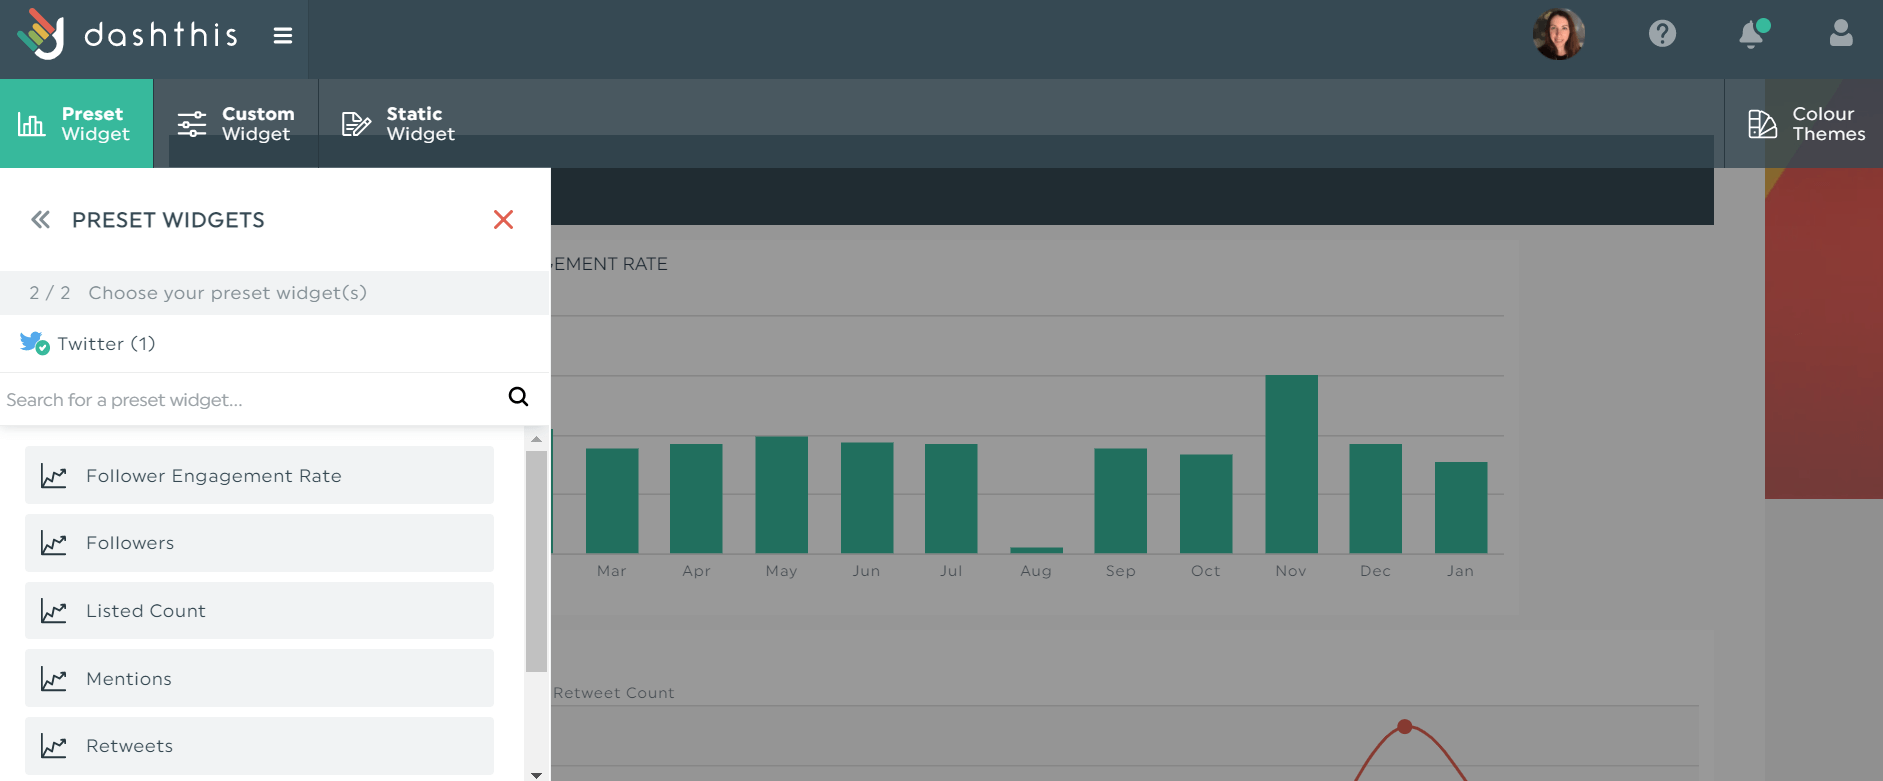
First, go to the Dashboard Manager and:
- Connect your favorite data sources
- Select your most important metrics from Preset Widgets
- Drag and drop as you desire
Your metrics should paint a clear picture of what’s happening in the business (e.g., if you’re analyzing churn, you’ll want to put customer acquisition cost, monthly recurring revenue, net profit, and customer lifetime value close together for a cohesive look).
Start Your Free 15-Day Trial on DashThis Today
The right KPIs unearth valuable insights, inform the following action plan, and inspire new strategies to exceed your client’s specific goals.
Now that you’ve learned how to monitor key performance indicators using DashThis, it’s time for the next step.
Grab your free 15-day trial to simplify your KPI monitoring, get a snapshot of your overall performance across all channels in one dashboard, and wow clients today.

Ready to scale your business?
Read More

Don’t miss out!
Follow us on social media to stay tuned!
Automate your reports!
Bring all your marketing data into one automated report.
Try dashthis for free