7 Important Things to Add in Your Client Social Media Report

The #deinfluencing trend proves that the rules of social media always changes.
Since raking up over 1.5 billion views on TikTok alone, consumers are rejecting the influencer culture and choosing the “mindful spending” route.
This is just one of the many new trends marketers need to adapt.
If your client isn’t as up to speed as you, you’ll need to highlight them in their social media report.
And that’s not all.
It’s also vital you educate them on the value of your work if you want to retain them in the long term.
Unsure what else to add?
You’re in the right place.
This guide walks you through the key elements based on what we’ve heard from marketers. We'll start with the role of these reports in an agency-client relationship and end with tips on presenting them to clients.
Skip ahead:
- DashThis Explains: What is a Social Media Report?
- The Role of Social Media Reports in Agency-Client Relationships
- What Your Clients Want to See in Your Social Media Report
- How to Streamline Your Social Media Reporting (The Templates Way)
- How to Present a Social Media Report That Captures & Maintains Clients’ Attention
- Automate Your Social Media Client Reporting with DashThis
DashThis Explains: What is a Social Media Report?
A social media report is a visual dashboard that highlights the overall performance across multiple social media channels, alongside recommendations for the next campaign.
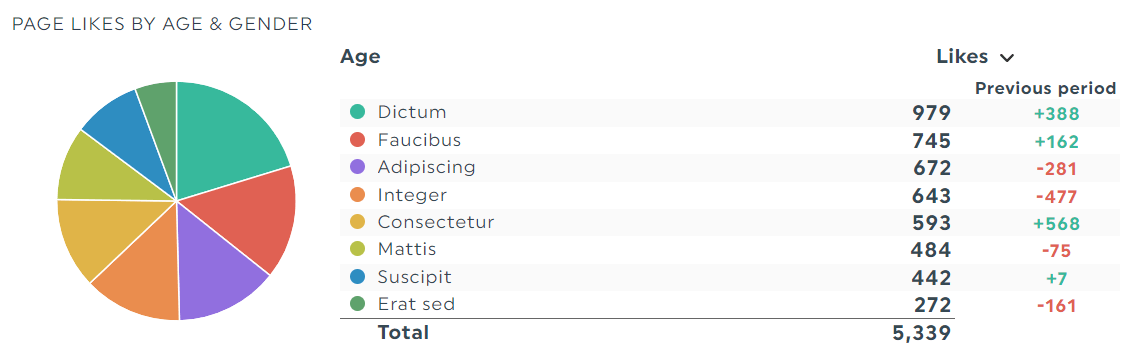
Take this social media dashboard on DashThis, for instance.
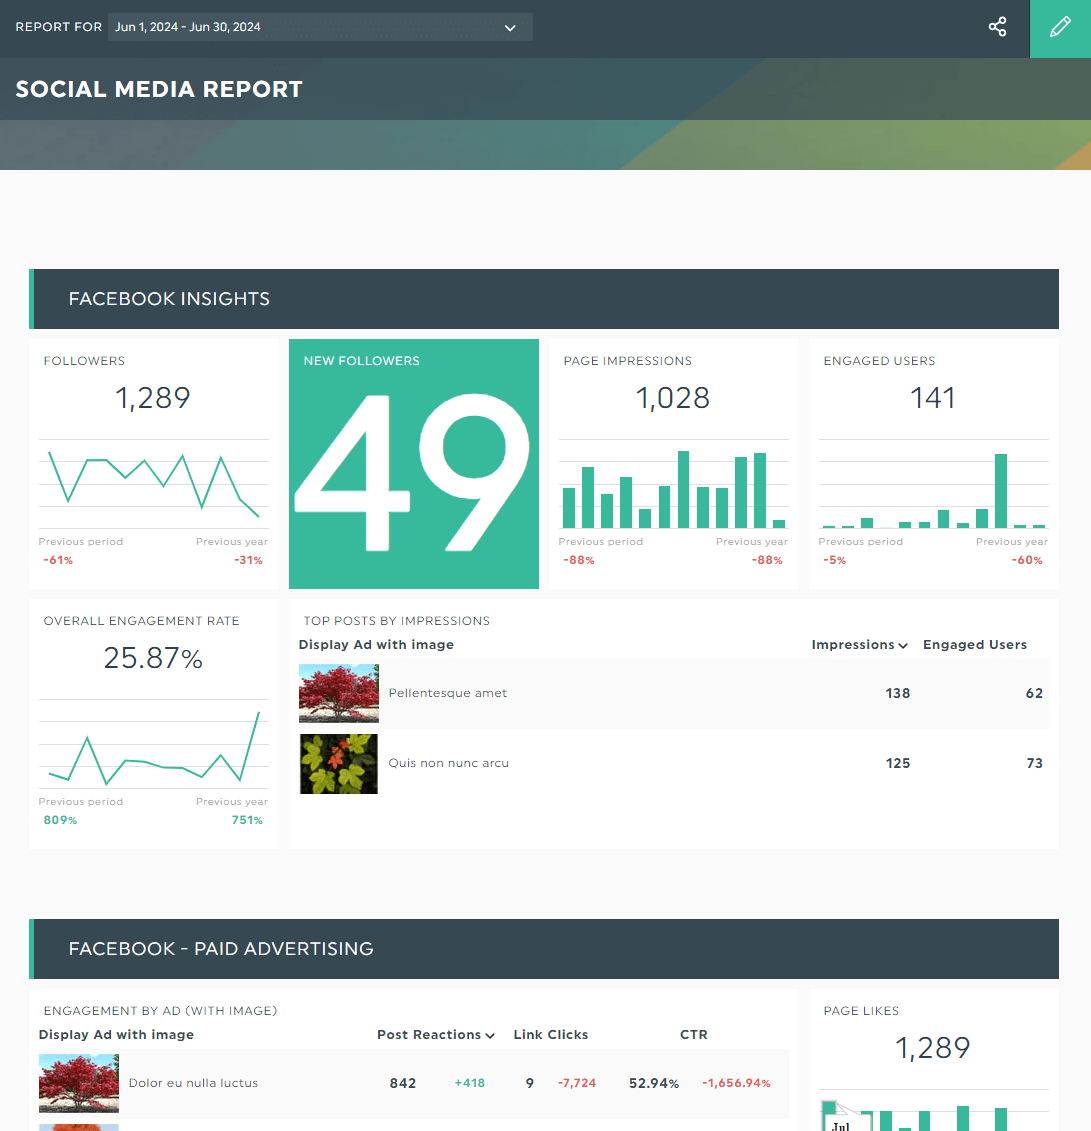
Grab this free social media report template with your own data!
By gathering all key metrics across multiple channels into one report, you quickly identify your top social networks and determine how they contribute to the overall traffic, revenue, and brand.
Start your free 15-day trial to automate your client social media reports today.
The Role of Social Media Reports in Agency-Client Relationships
Consumers today engage in social media differently.
From decreasing social media usage to #deinfluencing, brands that want to continue capturing consumers’ attention need to adapt to their evolved social behavior.
There’s a lot to unpack and educate your clients who likely aren’t as up-to-date on the latest social media trends as you.
And that’s where your social media analytics report comes in.
Besides educating them on the changes and value of your work in this ever changing landscape, you’re also:
- Identifying areas of improvement with zero guesswork, thanks to the easy-to-understand graphs and charts
- Building authority, transparency, and trust by backing up strategic goals with data
- Elevating the client experience through clear and on-the-dot communication (reporting tools like DashThis offers automated report distribution)
All these points improve your social media efforts and client retention in the long term.
What Your Clients Want to See in Your Social Media Report
We asked marketers from different industries on what they expect to see in a social media report, and here’s what they said.
To make this section even more valuable, we also share our professional take and walk you through how to add these elements using DashThis.
Let’s start from the top.
1. OUR TAKE: EXECUTIVE SUMMARY
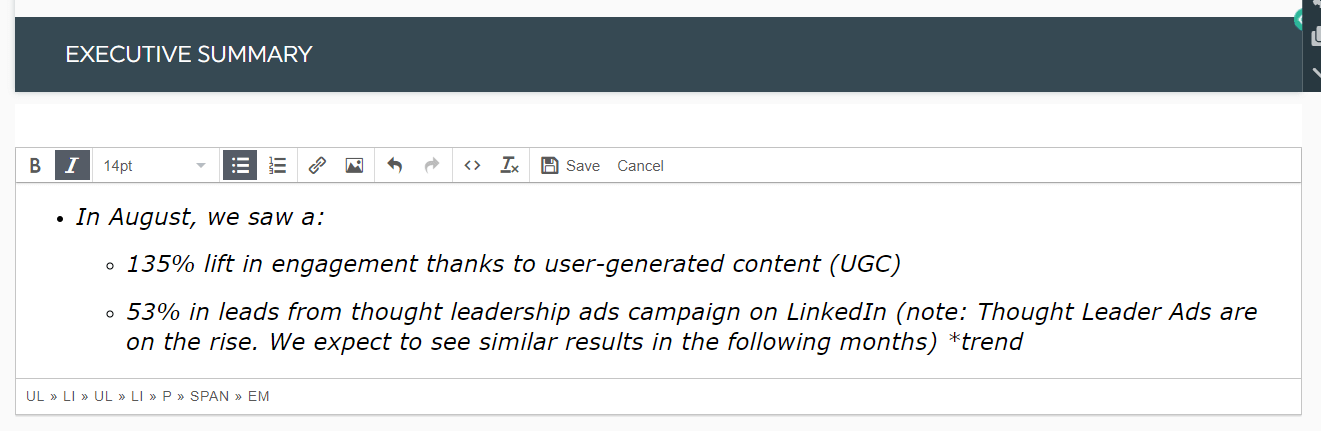
What it is: Overview of the report's main takeaways (opt: and current trends)
Example:
In August, we saw a:
- 135% lift in engagement thanks to user-generated content (UGC)
- 53% in leads from thought leadership ads campaign on LinkedIn (note: Thought Leader Ads are on the rise. We expect to see similar results in the following months) *trend
The executive summary adds clarity to the data you’re about to present below.
Think of it as the report’s hook:
Descriptive, punchy one-liners that grab clients’ attention and make them want to read more.
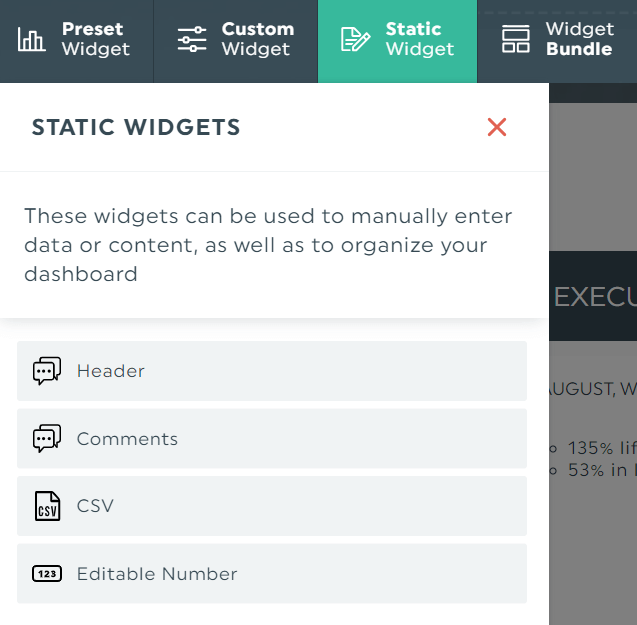
To add an executive summary in your report:
- Click Static Widget
- Select Comment
- Include your findings
- Click Save
If you want to draw more attention to it, add a header. Click Static Widget > Header and rename it.
2. OUR TAKE: GOAL & OBJECTIVES
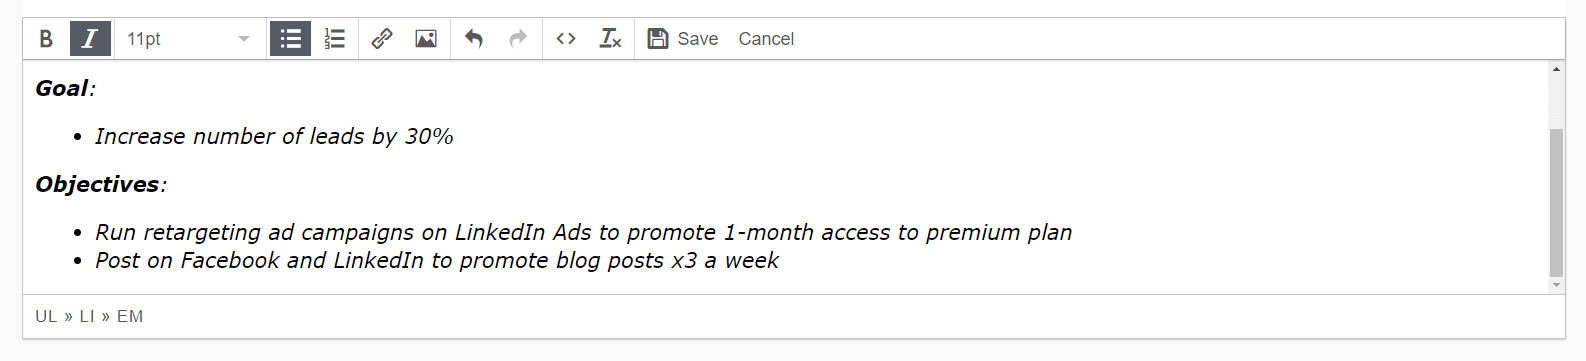
What it is: The client’s desired outcome and measurable actions you took to achieve it
Example:
Social media goals:
- Increase new users by 30%
Objectives:
- Run retargeting ad campaigns on LinkedIn Ads to promote 1-month free access to premium plan
- Post on Facebook and LinkedIn to promote blog posts x3 a week
Your goal and objectives should be placed alongside the executive summary.
That way, it flows seamlessly and keeps stakeholders engaged.
The best-fit KPIs and metrics will directly influence your measurable actions. In the example above, you’ll likely track metrics like cost per acquisition (CPA), number of trial users, and number of trial-to-paid users.
3. MARKETERS’ TAKE: AUDIENCE INSIGHTS
What it is: Audience demographic (e.g., age, gender) and their social behavior
Examples:
- Audience / follower growth rate
- Brand mentions
- Sentiment and tone analysis
Audience insights came out tops when we spoke to marketers.
And we agree.
There’s no better way to validate you’re selling to the right target audience and identify untapped customer segments.
In this section, you’ll want to focus more on sentiment and tone analysis.
Take Kenko Tea.
Initially, it targeted only traditional matcha drinkers on social media. After its agency sent over a report, it unearthed a passionate subset of customers: bakers.
The eCommerce store overhauled its social media strategy and created new recipe videos and photos of matcha desserts to showcase the versatility of its product.
In the end, engagement, brand mentions, and collaborations with bakers and F&B influencers increased by tenfold.
4. MARKETERS’ TAKE: CHANNEL PERFORMANCE
What it is: Overall performance across different social media channels
Examples:
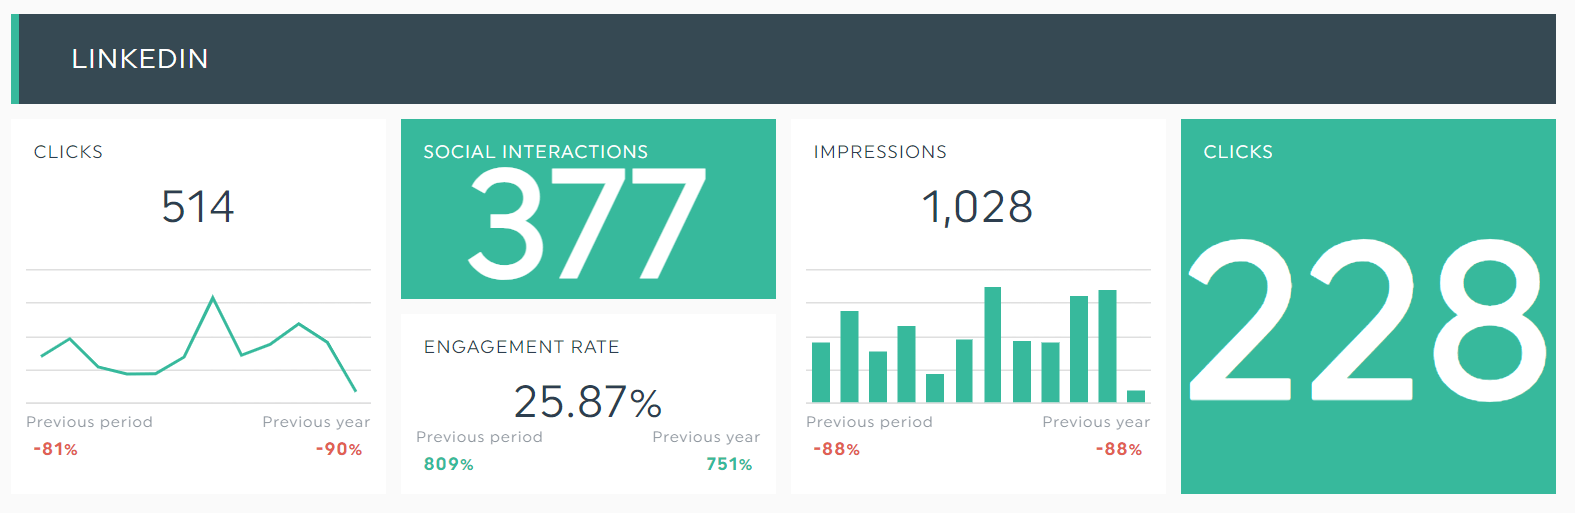
- LinkedIn: Number of clicks, engagement rate, number of impressions
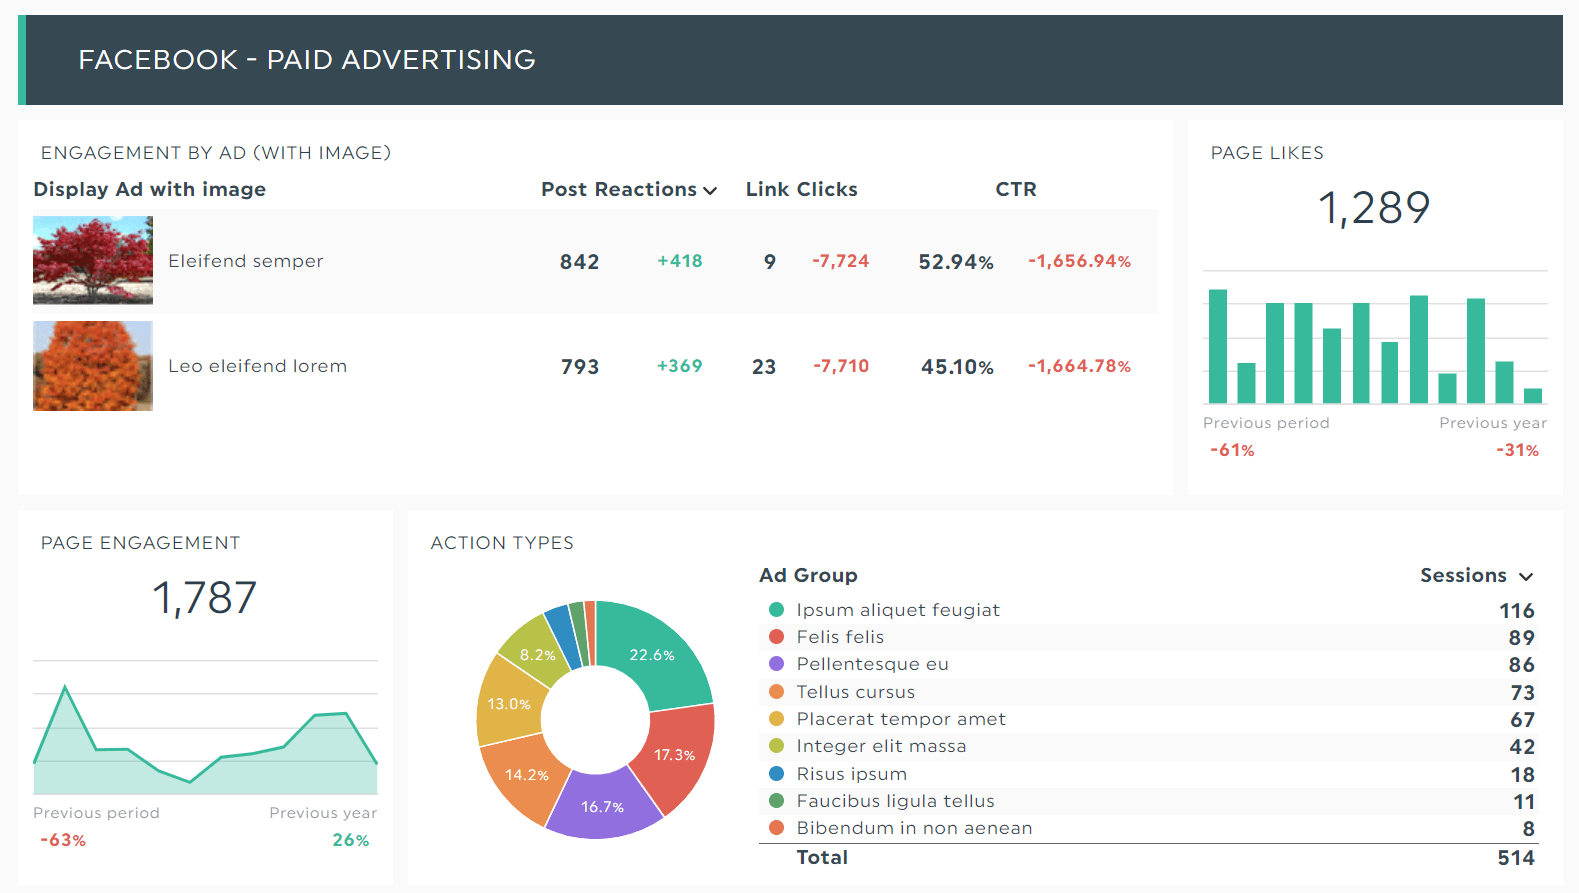
- Facebook: Number of followers, page likes by age and gender, new page likes vs. page unlikes
- Instagram: New followers, number of profile views, engagement by post
- YouTube: Number of subscribers, number of video views, watch time
Self-explanatory.
This section digs into your social media accounts so you can identify where your best customers hang out.
5. MARKETERS’ TAKE: Content Performance
What it is: The outcome of a post based on metrics like engagement, site traffic, and conversions
Example:
- Engagement
- Brand awareness
- Comments, shares, hashtags, and reposts
By tracking every single content’s performance, you know what resonates with your audience and what turns them away.
Suppose you’ve been posting about the ingredients in your edible-grade sunscreen all week.
Content fatigue sets in.
Consumers rarely engage with your social media posts.
There are several ways to improve at this stage.
Like sharing other types of content: behind-the-scenes of the manufacturing process, UGC featuring folks in your ideal customer profile (ICP), and short-form videos or GIFs to show the correct way of applying sunscreen.
By mixing these different posts in your social media content strategy, you stand a higher chance of engaging your audience even further.
6. MARKETERS’ TAKE: PAID CAMPAIGNS
What it is: ROI or ROAS of your paid social efforts
Examples:
- Click-through rate (CTR)
- Conversion rate (CVR)
- Cost per lead (CPL)
- Cost per acquisition (CPA)
- Return on investment (ROI)
- Return on ad spend (ROAS)
Pinpoint your most profitable campaigns so you can allocate more resources to generate more revenue.
Answer these questions to identify savings opportunities across your multiple social ads marketing campaigns:
- Which ads are generating the wrong clicks?
- Which landing pages are attracting our best-fit customers?
- Our ads are not earning clicks. How can we improve our targeting / ad copy / ad visual?
7. MARKETERS’ TAKE: RECOMMENDATIONS
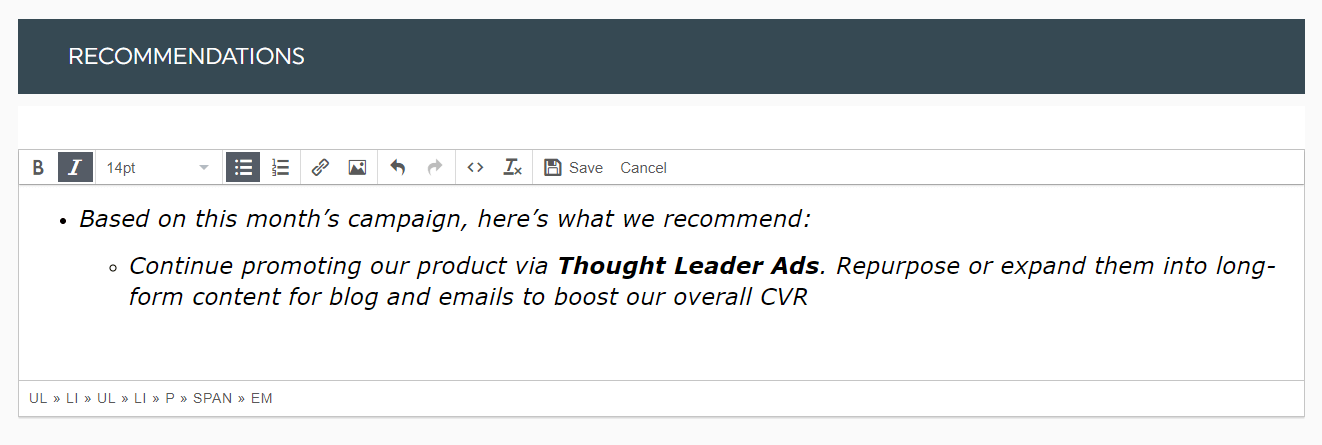
What it is: High-level, actionable advice based on trends and current performance
Example:
Based on this month’s campaign, here’s what we recommend:
- Continue promoting our product via Thought Leader Ads. Repurpose or expand them into long-form content for blog and emails to boost our overall conversion rate.
Recommendations don’t just lay out the next steps.
These data-backed suggestions also prove to clients you’ve mapped out a strategic plan for the projected future.
It shows clients you’re invested in their success.
How to Streamline Your Social Media Reporting (The Templates Way)
Templates are a popular choice thanks to their flexibility and vast customizable options.
Take our social media reporting tool, for instance.
It’s fuss-free to customize a template according to your client’s brand colors and the key performance indicators that matter most to them. Once you’ve finished tailoring them, clone it for future use.
Here’s how it works:
- Connect your social media analytics tools with DashThis
- Select a free template (e.g., social media template)
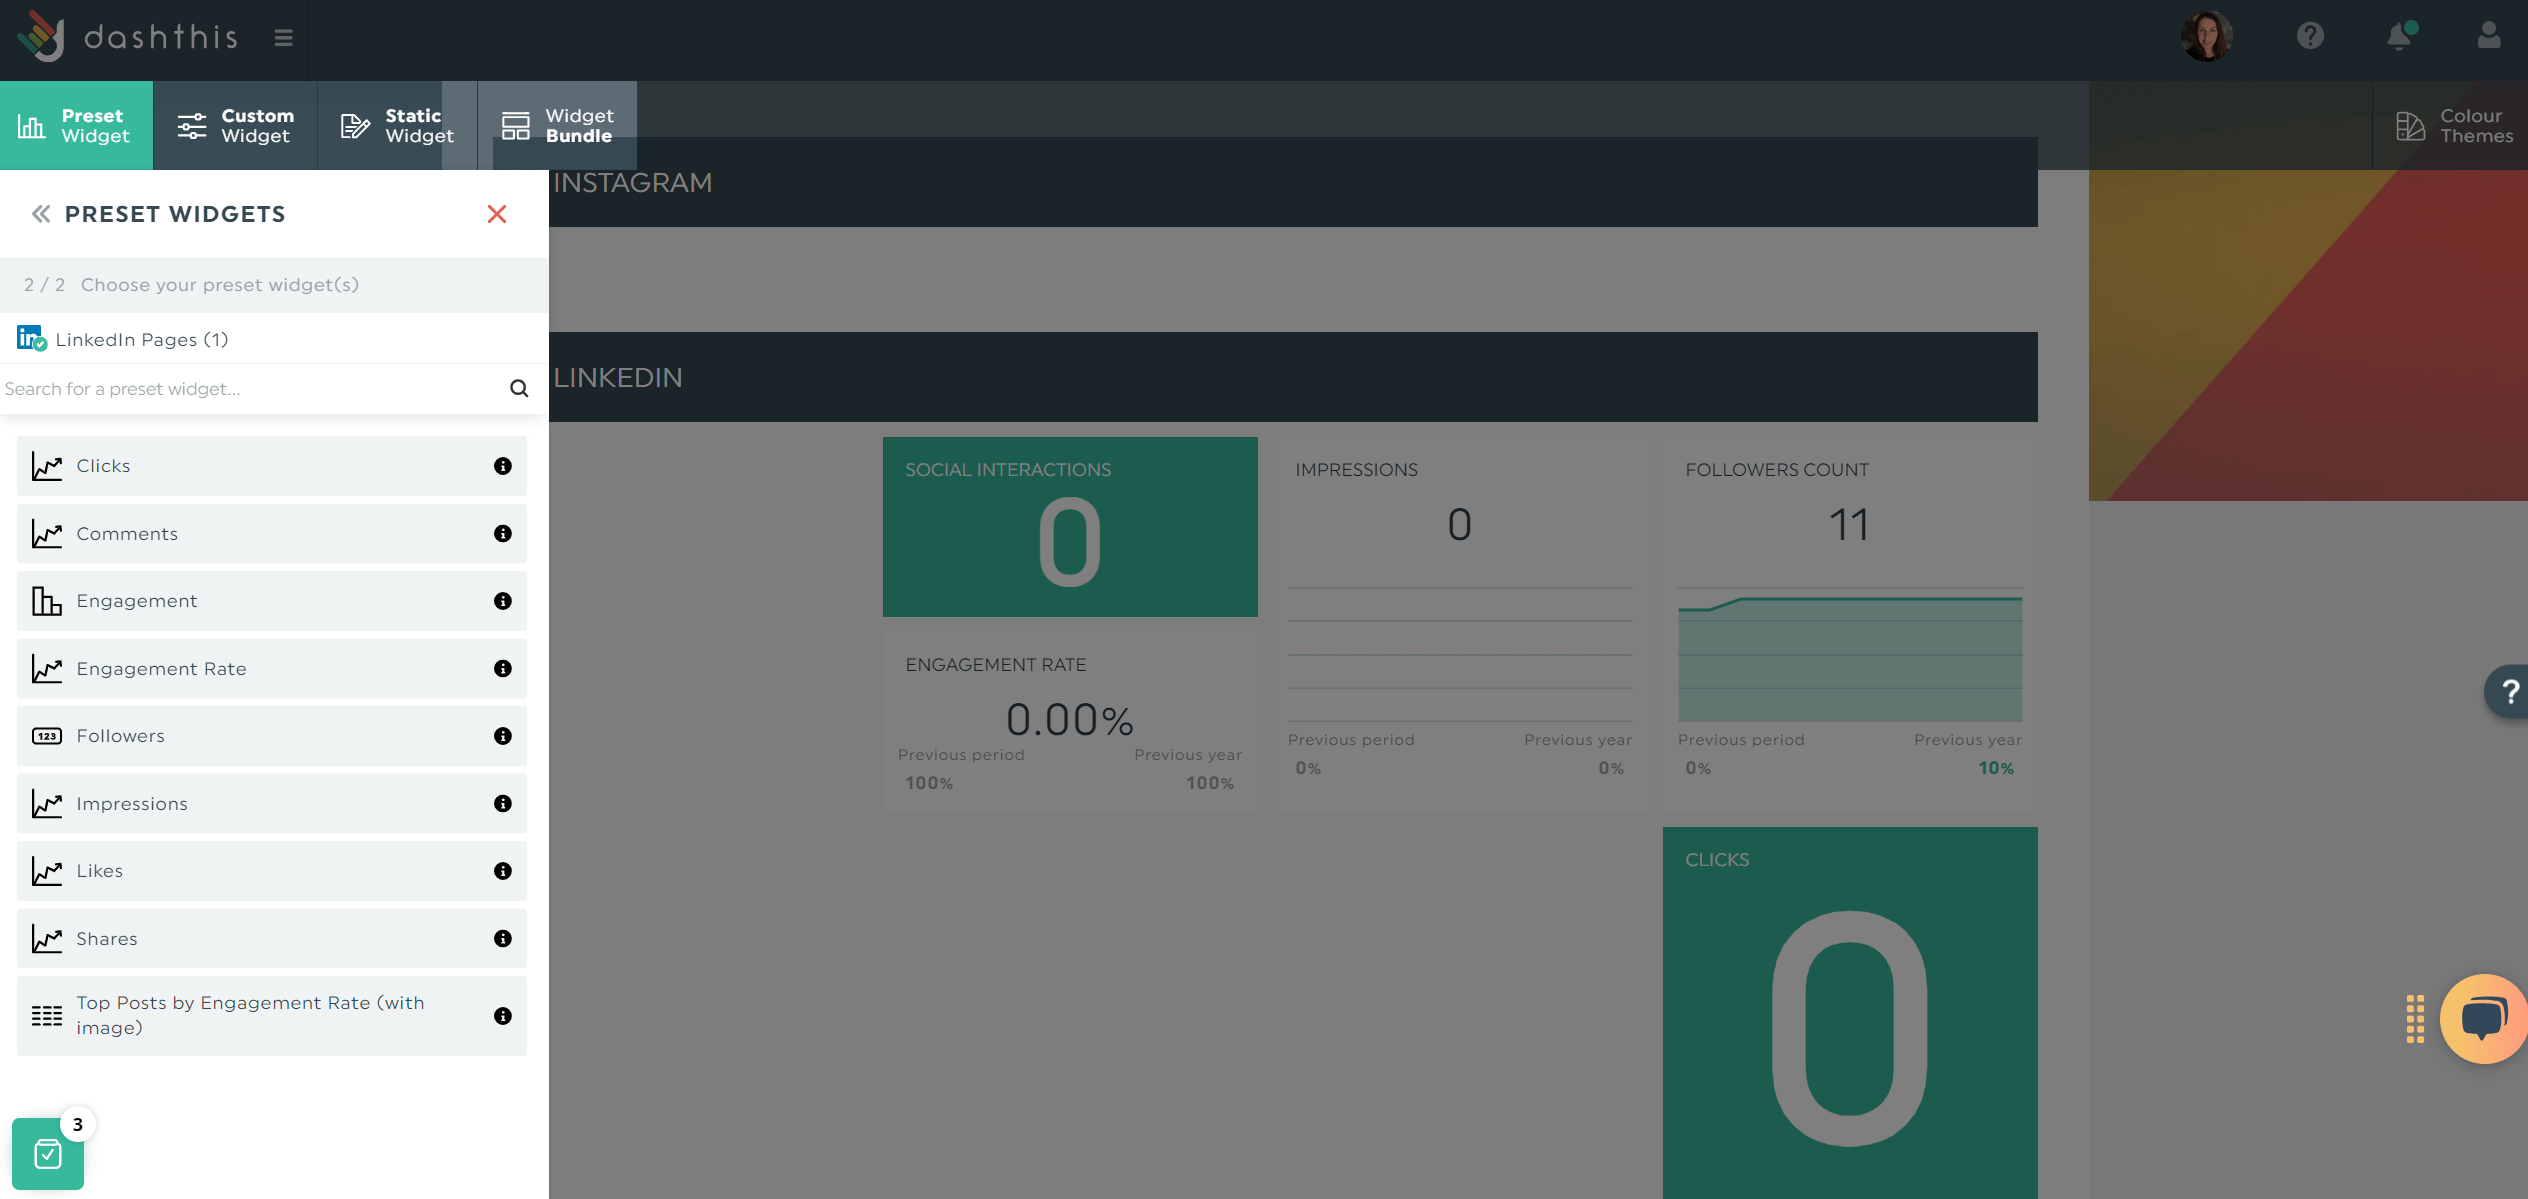
- Choose the metrics that matter most to your clients in Preset Widget
DashThis will grab your entire social media metrics from all accounts into your report, automatically. Drag and drop them to form a cohesive look.
Customize the report according to the client’s needs.
If it’s a social commerce report, highlight metrics like CPA and sales and the top-performing posts that drive revenue.
If it’s an all-in-one monthly social media report for a client with zero marketing expertise, focus more on client education.
In this case, our Notes widget comes in handy.
Use it to define marketing acronyms (GA4 = Google Analytics 4) and provide context for outliers (e.g., erratic metrics).
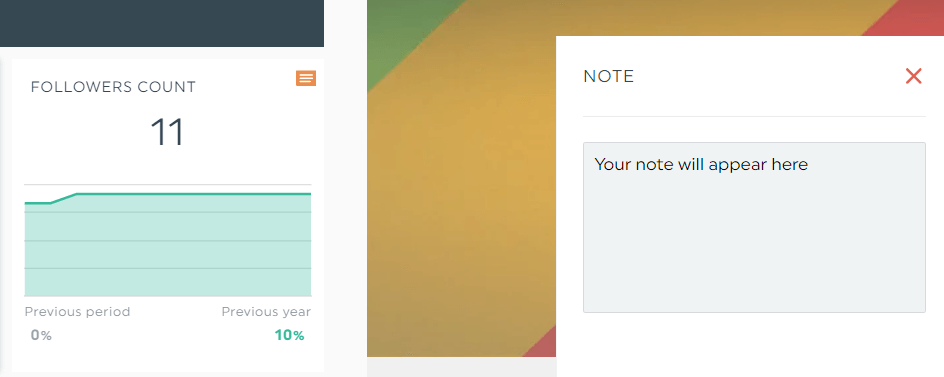
To access the note, click the orange tab
To clone the report for future campaigns, click Dashboard Options > Clone Dashboard.
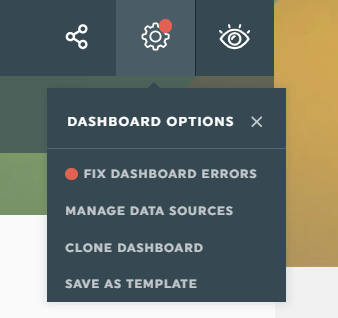
Alternatively, if you want to use this report for all clients, save it as a template.
Finally, schedule an automated email dispatch.
Here’s how it works:
- Hover to the Sharing Options icon on the top right
- Click Share by Email
- Set the dashboard period and frequency
- Click Schedule
Add an optional note and include the report as a PDF attachment.
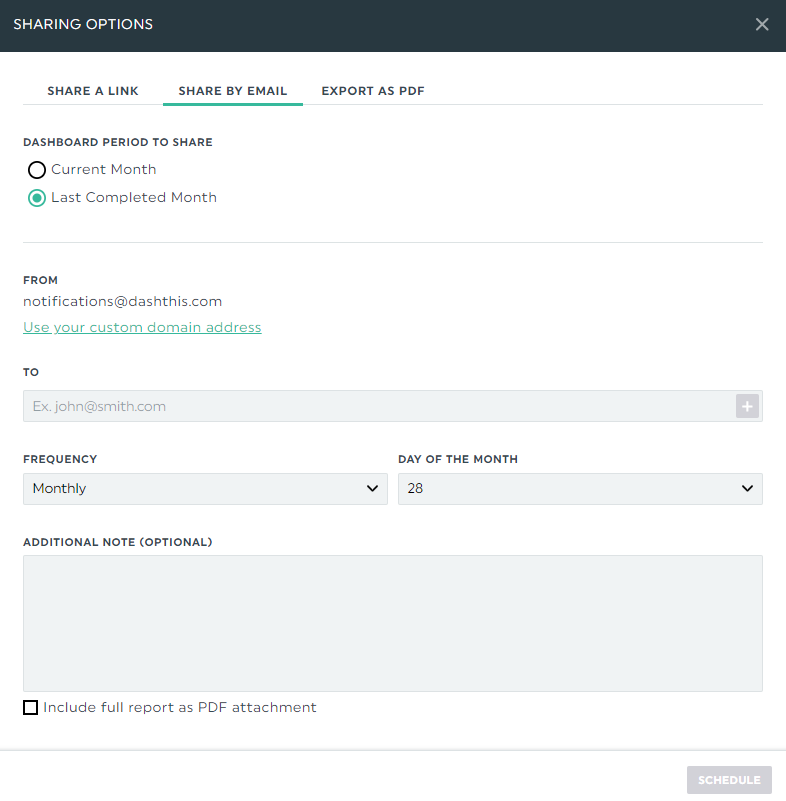
Or send over the report via a shareable URL link.
Both options let all stakeholders—marketing team or clients—view the report in their desired time frame.
Start your free 15-day trial to automate your client social media reports today.
How to Present a Social Media Report That Captures & Maintains Clients’ Attention
Our comprehensive social media reports work on small and big screens.
If it’s the latter you’re looking for, here are three tips to nail your presentation:
(i) Go BLUF
BLUF (bottom line up front) is a popular content approach popularized by Animalz.
It requires you to summarize your most important findings right away, before diving into the supporting details.
This military communications acronym works well across all channels: blogs, emails, social platforms, and reports.
So what makes an information important?
Here’s the way we think about it:
- Social media KPIs and metrics that impact revenue (e.g., X% increase in engagement > X% decrease in CPL and better ROI)
- Insights about customer demographics or behavior (e.g., untapped customer segment that could be profitable)
- Next steps for future campaigns (e.g., integrating SEO with social strategy instead of silo-ing both initiatives, focusing marketing efforts on retargeting with UGC)
(ii) Focus on actionable insights
Insights are strategic or tactical learnings distilled from data.
They move the needle forward.
Answer the following questions to identify them:
- What’s the main takeaway from our quarterly reports? “Our most profitable customer segment is susceptible to brand switching. Here’s what we recommend for the next social media campaigns...”
- What’s the next step in our social media marketing strategy? “We should consider partnering with XYZ brands to create co-marketing campaigns in the next quarter. They excel at putting an emotional spin in their digital marketing...”
- How does our monthly social media performance impact the bottom line? “Given our current performance and the size of these brands’ social media platforms, we estimate a X% increase in engagement and sales.”
(iii) Get feedback you need
Great feedback only happens in a two-way conversation.
Instead of asking “What do you think of this monthly report?”, opt for the in-depth questions below. You draw valuable information from clients this way:
- What were the most / least helpful points we’ve covered?
- Do you see any gaps we might’ve missed?
- Is there anything else you’d like to mention that wasn’t covered?
Automate Your Social Media Client Reporting with DashThis
Your client social media report spotlights the value of your work.
Even as the landscape changes, the principles will continue to hold true. Add the elements above. And try the presentation tips to raise your clients’ experience.
DashThis is the easiest reporting tool.
Gather all social media data across different channels into one beautiful report automatically. This way, you analyze your overall performance in a single tab, distilling valuable insights and spotting revenue opportunities quickly.
Start your free 15-day trial to automate your client social media reports today.

Ready to take your social media reporting to the next level?
Read More

Don’t miss out!
Follow us on social media to stay tuned!
Automate your reports!
Bring all your marketing data into one automated report.
Try dashthis for free