How to Measure Advertising Success In Your Client’s Campaigns (Examples + Recommended KPIs)

Coca-Cola is one of the world’s most recognizable brands today. Its marketing success is partly because of its massive $4 billion advertising budget and comprehensive marketing strategy.
Besides the brand’s rich history and focus on innovative advertising campaigns, Coca-Cola regularly monitors advertising metrics like profit per invested dollar in marketing and brand equity to understand whether its campaigns effectively bring in new customers or achieve the desired results.
If there’s one thing we can take away from Coca-Cola's approach to advertising, it's the importance of regularly monitoring its marketing efforts to measure its advertising success.
Whether you’re developing a digital advertising strategy for the rest of the year or looking to improve how you report on your client’s advertising metrics, we’re here to help! This guide will help you define advertising success, which metrics to track, and how to bring all your data together in a user-friendly manner with DashThis.
What is advertising success?
First, let’s zoom out a little and define advertising.
Advertising activities usually refer to paid forms of marketing, such as:
- Social media ads
- Podcast or video ads
- Display advertising efforts like Google Display ads
- Paid search ads
- Offline advertising activities like billboard ads or physical marketing collateral
So, how do you define successful advertising?
It’s when a campaign achieves the goal it set out to accomplish. For example, a successful brand awareness advertising campaign leads to more people searching for the brand. These efforts translate to increased website traffic or positive brand mentions on social media.
Similarly, we measure the success of a sales-focused advertising campaign by the number of sales it generates, its overall impact on business revenue, or the cost of customer acquisition.
Besides achieving its goal, successful advertising campaigns also make financial sense for the business. Ask yourself these finance-related questions when trying to see if a campaign was a success.
- Did the campaign generate the greatest return on investment for its advertising budget?
- How does the performance compare with other campaigns in our marketing strategy?
Answering these questions requires understanding and tracking specific metrics. Therefore, measuring advertising campaign metrics is crucial to measuring advertising success.
4 crucial elements of an effective advertising campaign
What does an effective advertising campaign have? Let’s examine some examples of successful advertising efforts and why they work.
Clear and concise message relevant to target audience
The best advertising campaigns feature a crystal-clear message tailored towards a specific target audience. Take this example of a Facebook ad from marketing agency KlientBoost for Best Self Co.

Image: KlientBoost/Best Self Co
Focused on promoting Best Self Co’s intimacy card deck during Valentine’s Day, the copywriting in this Facebook ad specifically highlights “date night” for busy couples. achieving an 11% higher return on ad spend (ROAS).
Strategic channel selection to reach the right people
You also need to know where your ideal customer hangs out and choose suitable channels to reach them. For example, audiovisual technology provider Elgato reaches its ideal customer by partnering with content creators to talk about their products and streaming regularly on Twitch.
Like Twitch’s audience of live streamers and people who consume video content is a natural fit for Elgato’s products, think about the content your ideal customers consume and which channels are best for your advertising campaigns.
Features a visually appealing and eye-catching design
You only have seconds to catch your audience’s attention, so your ads must attract attention quickly. And it doesn’t always mean resorting to exceptional production values.
Instead, prioritize making your ad relevant to your target audience. According to a Facebook study, the relevance of a video ad was the top reason people engaged with it, over factors like length, production quality, or service. Similarly, research by IAS shows the proper ad context can improve memorability by up to 40%.
Coca-Cola's 2011 Share a Coke campaign excellently combined relevance and eye-catching design. The global campaign featured the most popular names in each country on its iconic red-and-white branding. It focused on the vital message of sharing a Coke with family and friends with a personal touch.
The ad campaign was also incredibly successful, increasing U.S. sales by 2% after over a decade of declining revenues. At launch, the campaign hashtag #shareacoke was the number-one global trending topic on social media.
Optimize campaign elements based on results
Creating successful advertising campaigns involves A/B testing and other factors listed above. Focusing your tests on a specific advertising KPI and monitoring results over time makes it easier to tweak your campaign elements for maximum results.
For example, the e-commerce store The Red Wagon used A/B testing to optimize its Facebook ads and targeting strategy to maximize sales. It tested different targeting strategies to analyze which options brought in the highest number of purchases and the lowest cost per purchase.
Why track advertising KPIs to measure success?
Ad campaign elements like creative used, ad copy, audience targeting parameters, and ad format each have a role in determining your campaign’s effectiveness. But do you know which elements made a significant difference in performance? Here are a few reasons tracking advertising KPIs can help you create successful campaigns.
Evaluate advertising performance: How do you know if your campaigns are performing as expected? Create a client dashboard for both your team and your client to review. A dashboard will give both sides full transparency of crucial campaign metrics. It’s easier to make informed decisions when you’ve been tracking your metrics regularly.
Optimize current campaigns: Besides knowing advertising performance, tracking metrics help you identify opportunities to optimize your campaign performance. For paid advertising, a high impression count but a low click-through rate may suggest a problem with targeting or ad relevance.
Prove campaign ROI to clients: Do you need support for your advertising proposals? You must show you understand how your client’s business works and how your campaigns will help them reach their goals. Tracking business-related KPIs like ad-influenced revenue, ROI, and return on ad spend (ROAS) and linking them to your campaigns can help you show the value of your work.
6 recommended metrics to measure your advertising success
We’ve discussed the benefits of regularly tracking marketing campaign KPIs. If you’re unsure which KPIs to use to measure your campaign performance or compare different campaigns, get started with these six metrics.
- Impressions: Ensures your audience is seeing your ads
- Product and brand searches: Tracks how well your advertising campaign is boosting search intent for your brand or product featured in your campaign
- Click-through rate (CTR): Measures ad relevancy and if your ads capture attention
- Conversion rate: Essential metric if you’re running lead generation or campaigns to drive sales
- Return on advertising spend (ROAS): Measures campaign cost-efficiency. Consider including other cost metrics like customer acquisition cost or cost per conversion
- Engagement metrics: KPIs like engagement rate or clicks assess the number of times people interact with your ads
Pro tip: Use a dashboard to organize your report! It’ll make your data more accessible to reference, and more straightforward for clients to understand when you’re presenting campaign results in real-time. Bonus: save even more time by automatically gathering data for your campaign KPIs with report automation.
Get this advertising report template with your own data!
How to create an advertising report in minutes with DashThis
With your metrics in hand, how do you create a report without spending hours at your desk assembling a report manually?
We’re here to help you save time with automation.
First, let’s sign up for DashThis’s 15-day free trial here. Once done, use this step-by-step guide to create a report for your advertising campaigns.
Step 1: Decide what success looks like in your advertising
How would you define campaign success? Answering this question helps you decide what data to display and collect.
A lead generation-focused ad campaign might measure success by bringing in ready-to-buy marketing-qualified leads while maintaining cost efficiency.
Alternatively, your advertising campaign can be successful if it focuses on improving brand recall and educating potential customers in your target market about a new product launch.
Both campaigns measure success differently. Therefore, it’s essential to think through and discuss with your client how you’ll align your reports around a joint measure of success. It’ll make the entire reporting process easier to follow.
Once you’ve done that, start creating your report in DashThis!
- Click +New Dashboard
- Select a template
- Name it and click Next
Step 2: Identify relevant KPIs and customize your dashboard
DashThis’s drag-and-drop interface makes it easy to choose the metrics you’re reporting on. Use headers and sections to organize your KPIs into a logical, easy-to-follow flow for your client to review.
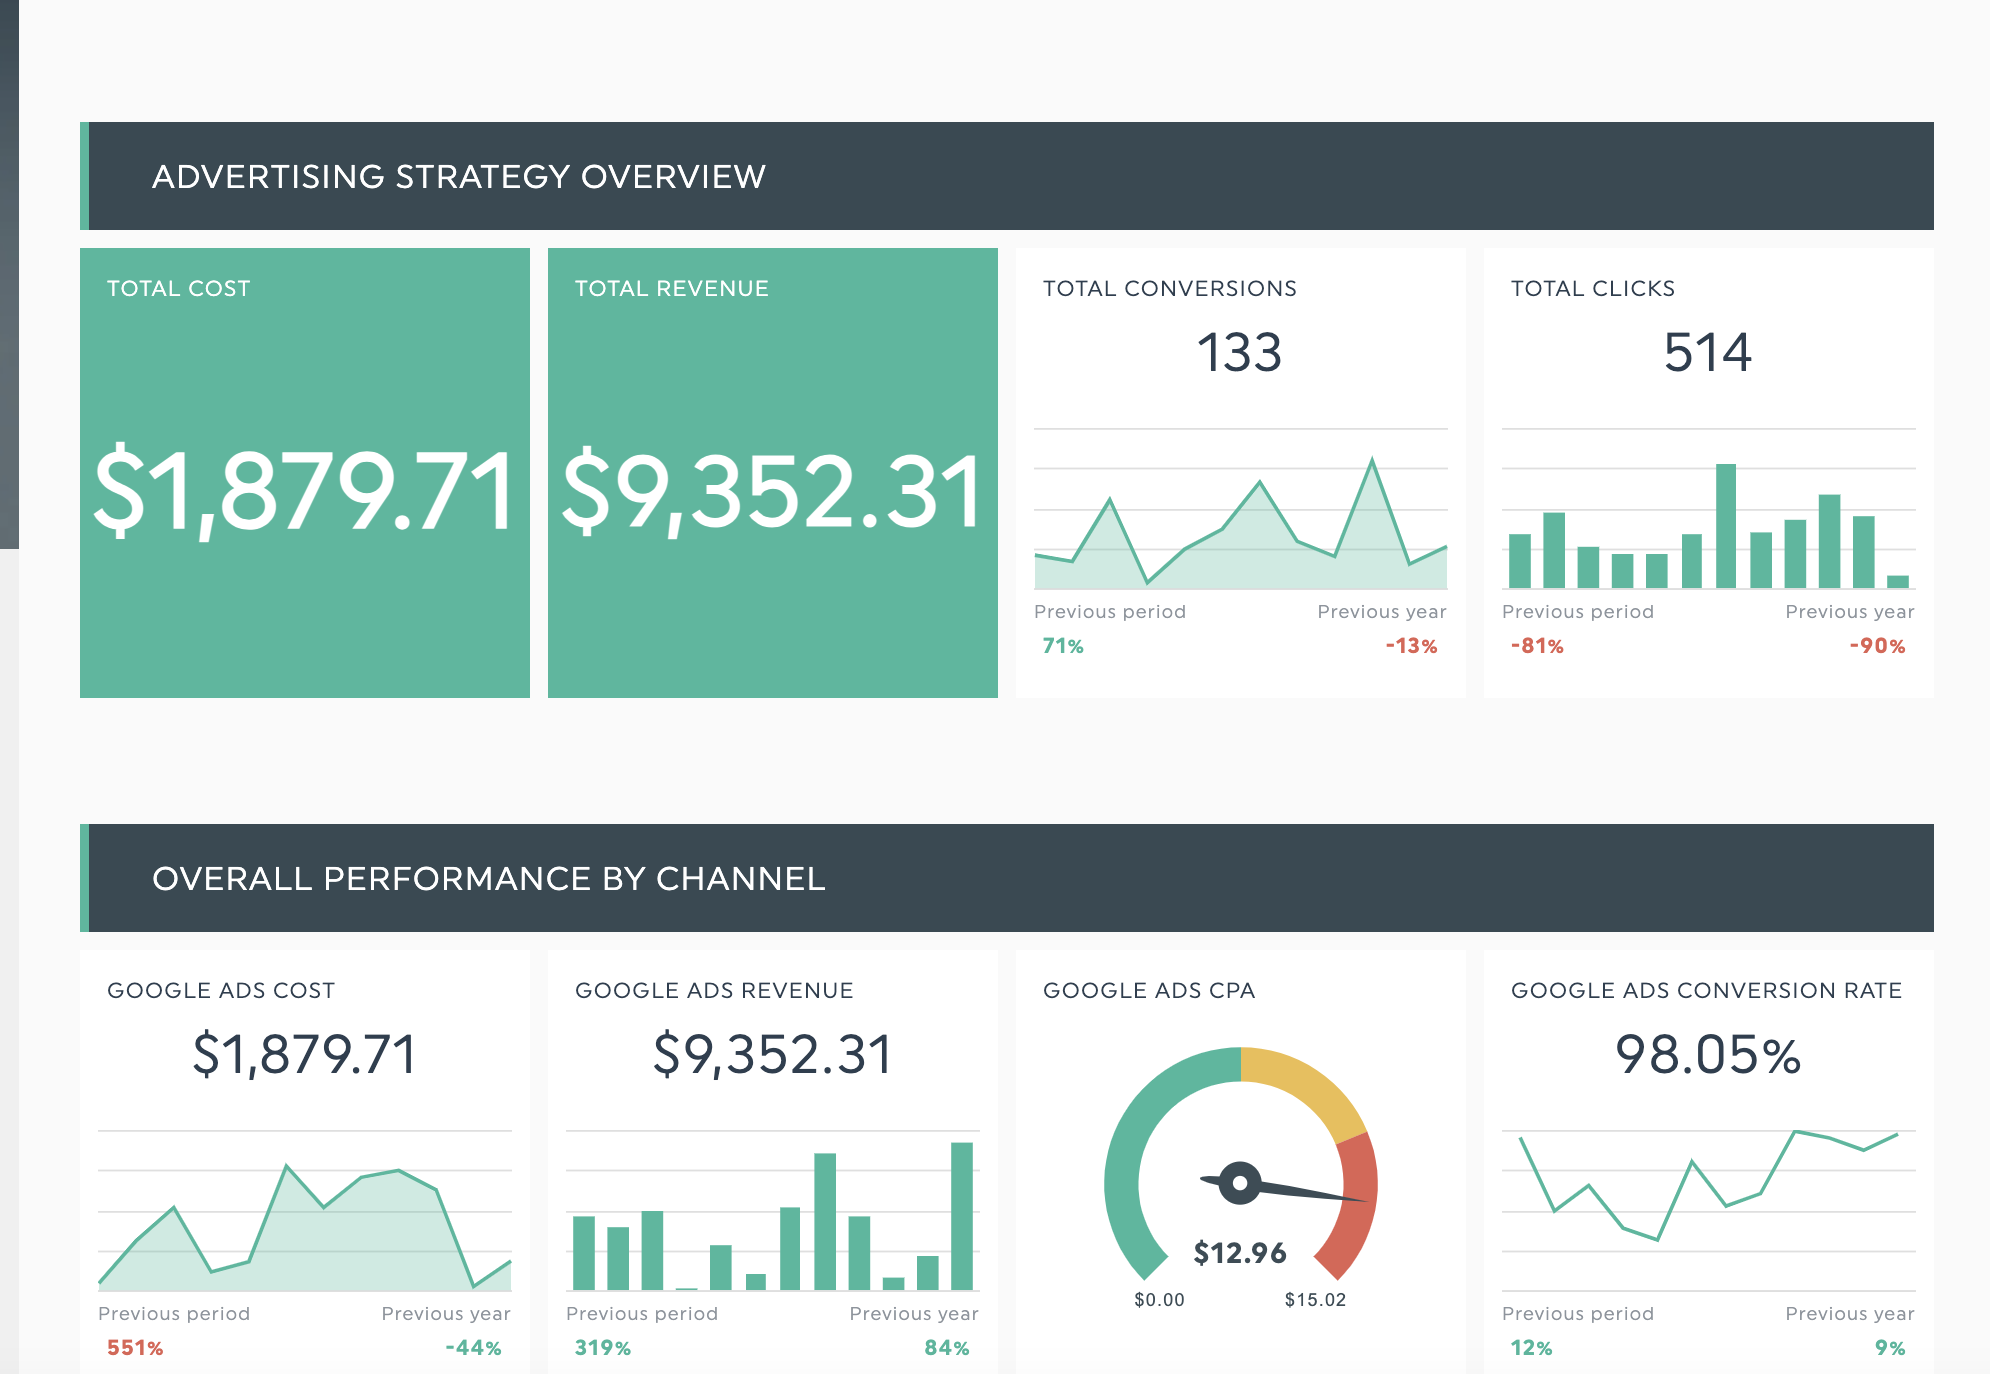
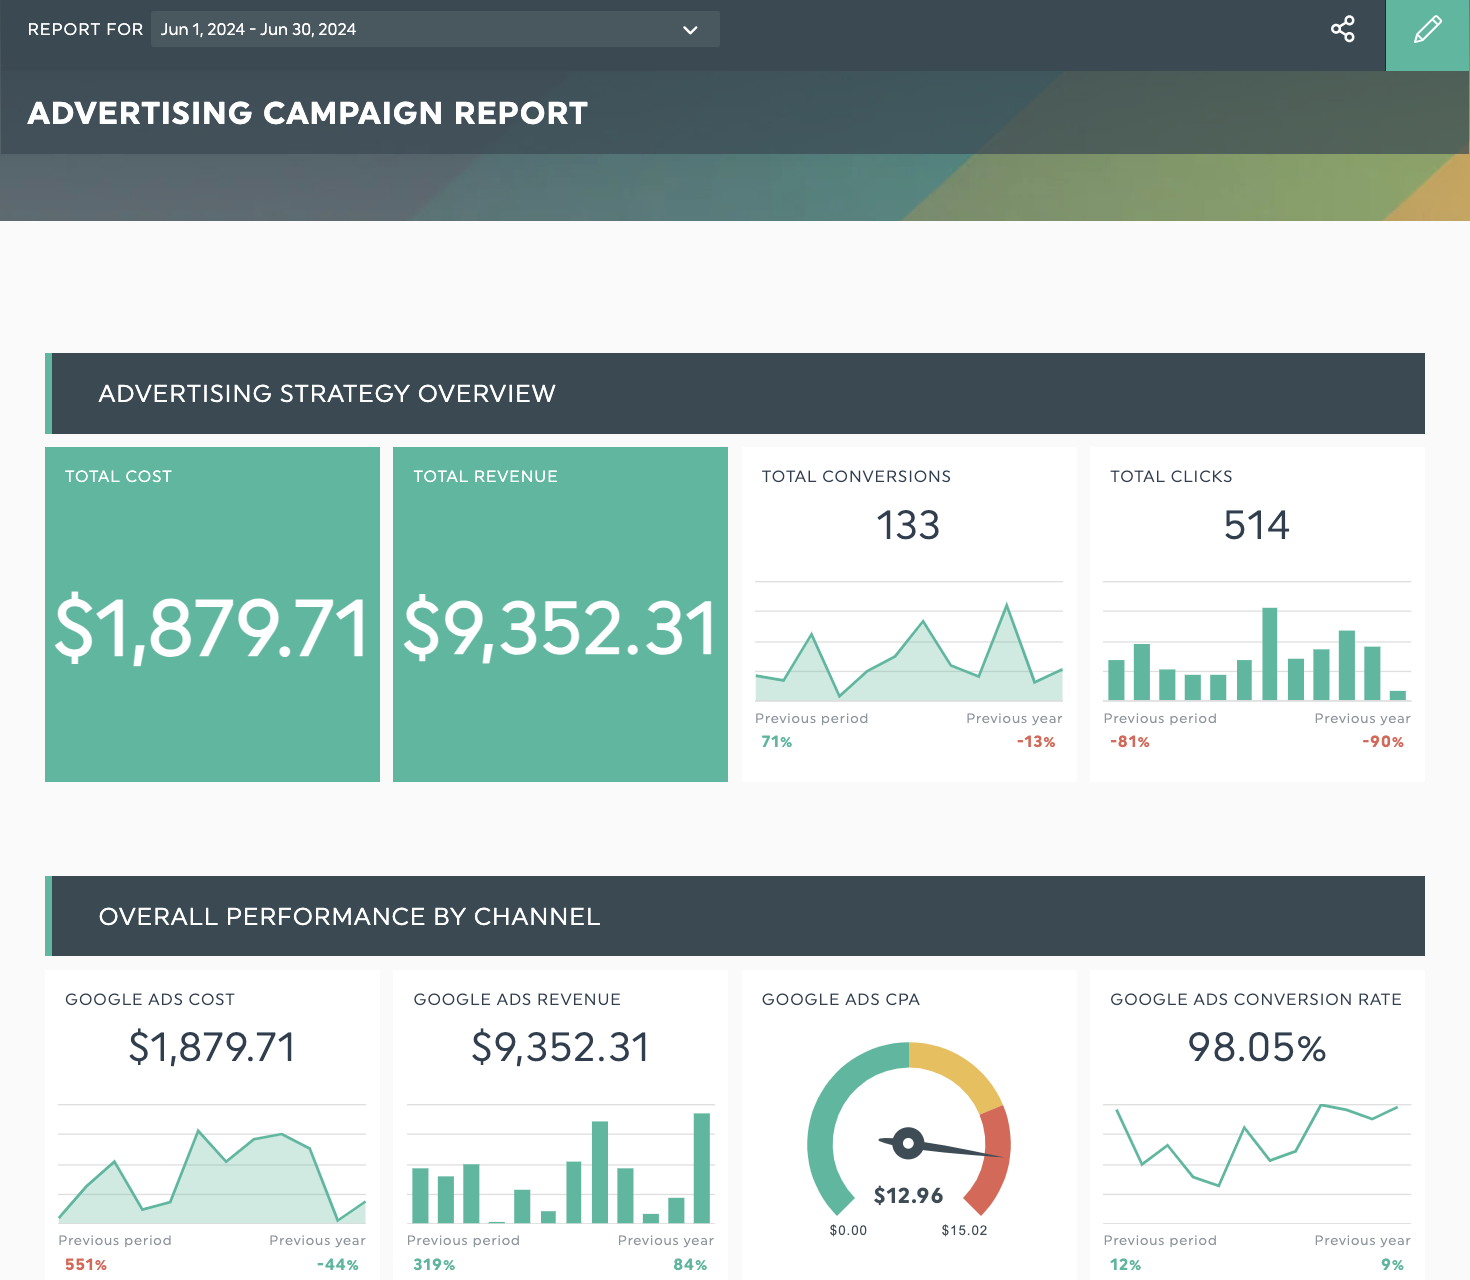
For example, you could highlight crucial cost and revenue metrics as a quick overview, followed by a section comparing the overall performance of each advertising channel in your custom report.
Get this advertising report template with your own data!
Besides headers and sections, you can also add different widgets to visualize your data. DashThis has multiple tools to make your data come to life, from editable numbers to call attention to cost-per-acquisition figures to graphs. Here’s a quick overview of these options.
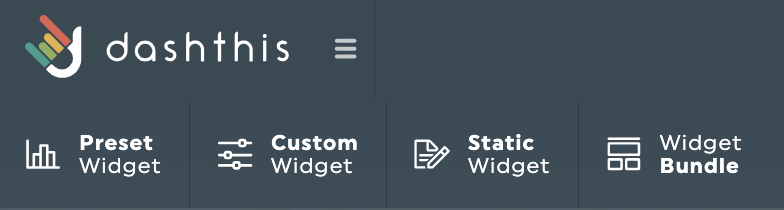
- Preset widgets: These are metrics that come with your connected data sources. They're great if you want to access relevant KPIs easily.
- Custom widget: As the name suggests, these widgets allow you to create your own widget type to visualize data. For example, you could visualize your audience demographic data in LinkedIn ads with a pie graph.
- Static widgets: Keep your reports organized with headers and comment boxes. You can add editable numbers or embed a CSV file for easy reference.
Or, if you need a simple place to start with reporting, why not use our advertising campaign report template? This template includes all the preset KPIs you need and a structure to customize the report.
Get this advertising report template with your own data!
Step 3: Collect data for analysis
Add the data sources you’re reporting using the Connect button.
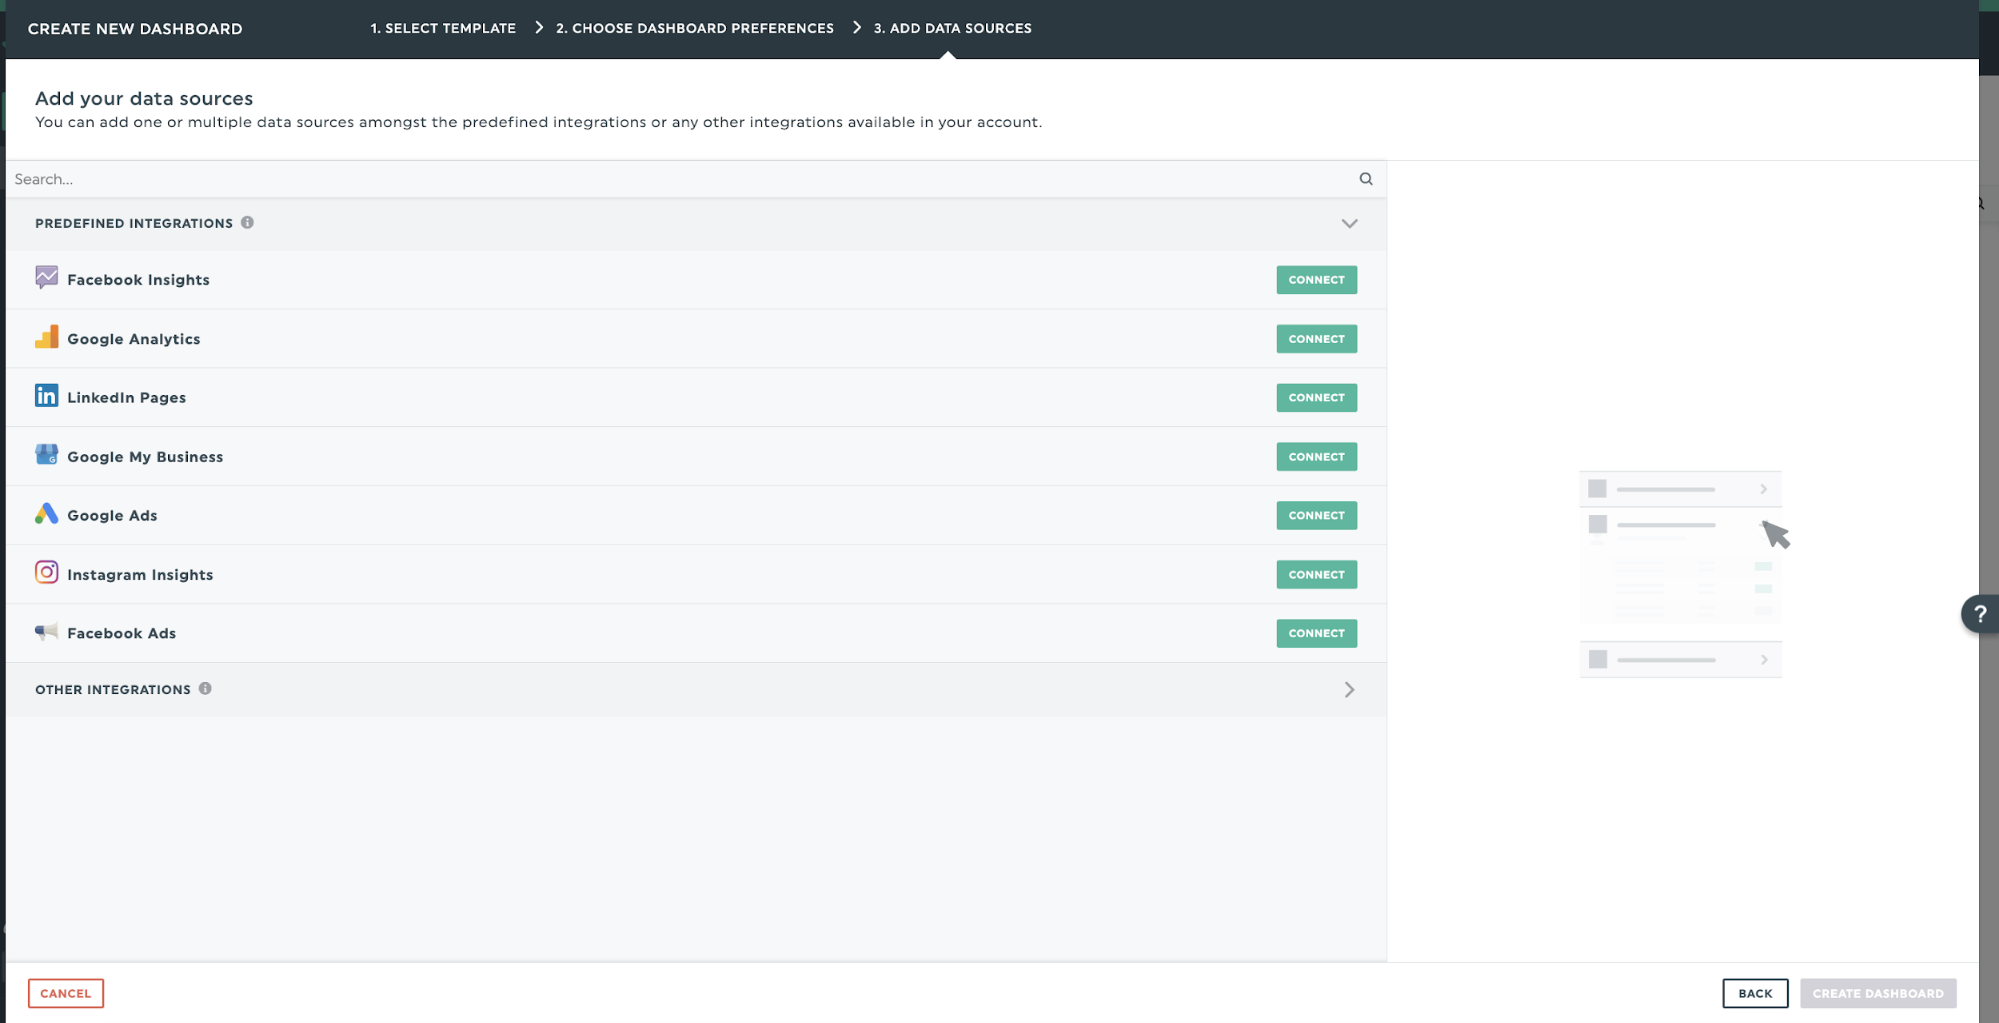
As soon as you give DashThis permission to access your marketing data in each tool, DashThis will automatically import your latest data from your selected channels and keep your reports up to date.
Step 4: Analyze your data and create actionable client recommendations
Your reports get more valuable when you use data to answer your clients' concerns and guide them on what to do next. Thankfully, data analysis doesn't have to be a hassle with the right questions and tools.
Imagine analyzing your latest multi-channel advertising campaign. Data shows conversions are improving by 20% from last month. Start asking questions to analyze your data thoroughly. Here are a few questions you can start with:
- Why did the increase happen?
- Did the improvement come from a specific channel?
- Was the increase because of a particular tactic? Or was it caused by seasonal or external factors?
- What can we do to replicate this success?
With the answers to these questions, you can then create a recommendation for your client.
For instance, let’s say you sell air purifiers for pet owners and observe a performance improvement after shifting your pay-per-click (PPC) advertising budget to target allergy-related keywords. You could recommend investigating whether there are other related keywords you could include further to capture the search traffic from these keyword topics.
Pro tip: Use a comment box widget to include the answers to these questions without cluttering your report! Here’s how.
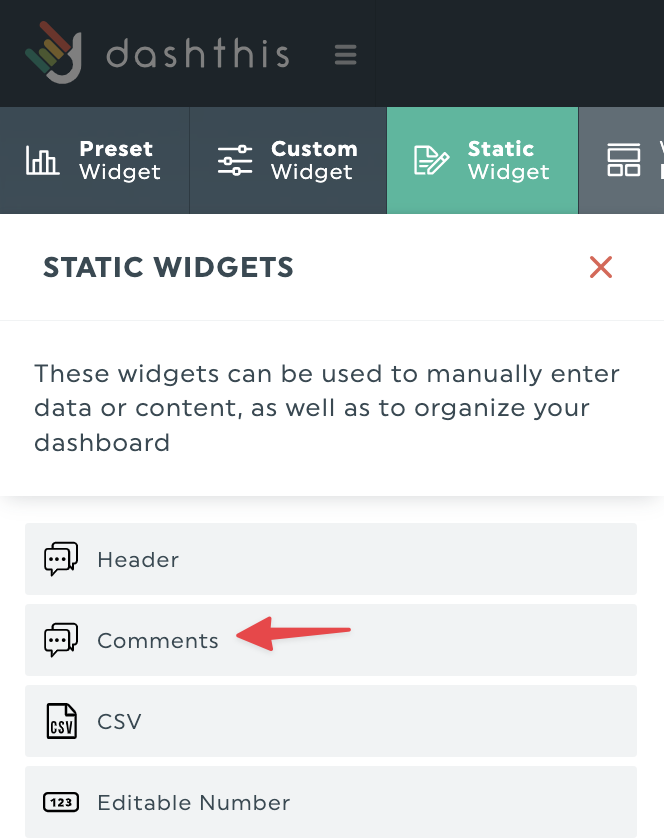
- Click Static Widget
- Select Comments
- Add your insights
Step 5: Share your report
You're now ready to send your report to your clients.
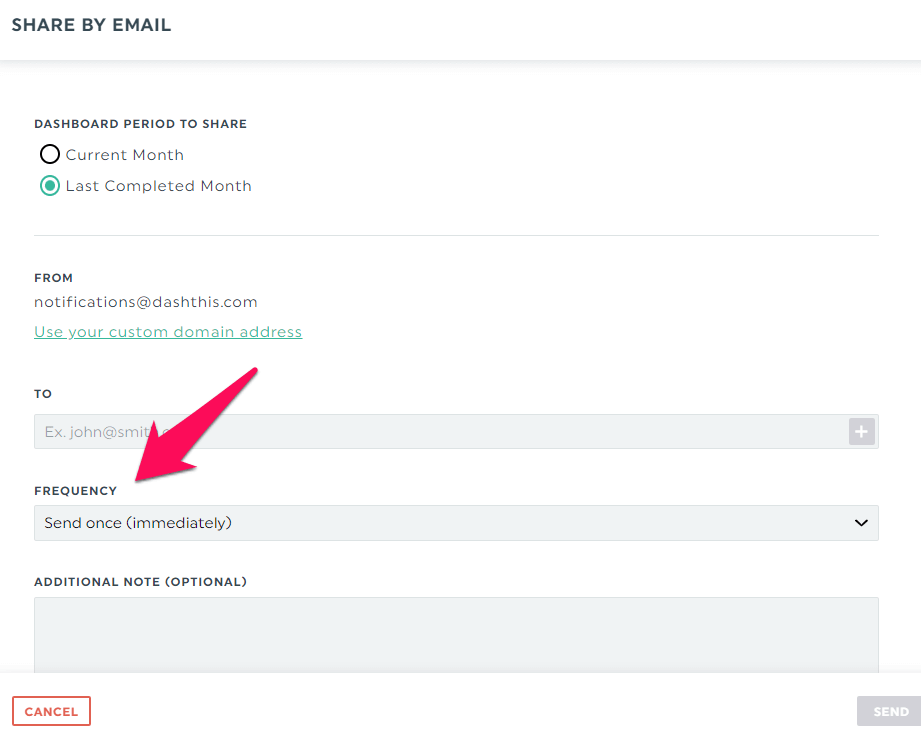
This step seems straightforward, but it’s also easy to forget when you’ve got other things on your plate. Use DashThis’s automated scheduling to help you ensure that your report reaches your clients at the same time each week with minimal effort.
Click Sharing Options > Share by Email > Frequency to schedule your reports.
DashThis lets you schedule reports at regular intervals. Suppose you work with a digital marketing specialist and a head of marketing on a multi-channel advertising campaign.
You could schedule a weekly PPC and Facebook ads performance report for your digital marketing specialist and a monthly overview for the head of marketing.
DashThis also offers options to download your report as a PDF for offline viewing. If you’re preparing for an in-person meeting, you could share a specific URL link to meeting attendees. Clients can click on the URL to review your comments and hover over specific data points for more detail.
Automate your ad reporting with DashThis
Measuring advertising success is critical to developing campaigns that drive client results. By showing the relationship between advertising activity and business results, you can quickly get your client’s support for current and subsequent campaign proposals.

Track your advertising success with Dashthis today!
Read More

Don’t miss out!
Follow us on social media to stay tuned!
Automate your reports!
Bring all your marketing data into one automated report.
Try dashthis for free