How to Track Facebook Ads in Google Analytics 4

Google Analytics 4 doesn't really know how to differentiate paid social from organic.
If you do a quick search on forums, you’ll see many users lamenting about their paid and social advertising campaigns being randomly flipped.
The best way to combat this odd flaw, according to the paid social experts we spoke to, is to add UTM parameters at the end of your destination URL.
By tracking your Facebook Ad campaigns with these parameters on GA4, you get a clearer picture of the entire user journey—all the way from the ads that captured their attention to how they interact with your website.
In other words, you’ll know where to improve with little guesswork.
So…how do you do this?
In this guide, we’ll walk you through how to use these parameters to track your Facebook Ads on this next generation of Analytics.
- How to Set Up Facebook Ads Tracking in Google Analytics 4 While Minimizing Discrepancies
- Top 5 Metrics to Track for Facebook Ads If You Don’t Know Where to Begin
- DashThis: An Alternative for Breezy Reporting
- How to Auto-Create a Facebook Advertising Report on DashThis
- Automate Your Facebook Ads Reporting with DashThis Today!
Note: This guide uses Meta Ads and Facebook Ads interchangeably.
How to Set Up Facebook Ads Tracking in Google Analytics 4 While Minimizing Discrepancies
Before we begin properly, we need to stress one important point:
There’s no 100% accurate attribution.
With both channels measuring conversions differently—not to mention the other gazillion factors that impact reporting discrepancies—you’re embarking on a measurement maze that never ends.
To make tracking as pain-free as possible, your best bet is to follow these prerequisites:
- Check you follow GA4’s channel definitions for your UTM parameters. This ensures more accurate tracking and prevents your data from being flipped.
- Make sure you can access both GA4 and Facebook Ads Manager (admin/advertiser role for Facebook Ads and editor/administrator for Google Ads)
- Don’t fret if the data feed shows up empty! Google Analytics, for instance, takes around 30 minutes to collect data.
All good?
Great, let’s begin.
1) Set up Google Analytics 4 property
Note: Since WordPress is the most widely used website builder, we’ll use it as an example in this tutorial. If you're using another web-hosted platform, don't worry! The steps are pretty similar.
Let's start with Google Analytics 4.
In Admin, click Create > Property.
Enter a name for your property.
Next, select the reporting time zone and currency. This determines the day boundary for your reports.
Click Next and pick your industry category and business size.
Select Next again, along with how you’re using Analytics. Your selection will determine your set of default reports. For example, if you pick “drive online sales”, you’ll see a collection of eCommerce purchases reports in your dashboard.
Click Create and accept the terms of service and data processing amendment.
Under Add a data stream, click Web.
Complete the following fields accordingly (e.g.,enable enhanced measurement to send events right away). Click Create stream.
The last and most crucial step is to tag your measurement ID to your website. There are a few options for doing this:
- Option 1. Via your content management system settings (requires Google Analytics 4 integration)
- Option 2. Using google tag manager (GTM)
- Option 3. By adding the Javascript tracking code in the header section of your website (gtag.js)
For most recent information we recommend that you follow the official steps from google available right here
Congratulations! You’ve successfully created a new GA4 property 🙌
2) Add Meta Pixel to your website
Now let’s set up your Facebook Ads tracking code.
Go to Meta Events Manager and click Connect data sources > Web > Connect.
Name your pixel and click Create pixel.
Enter your website URL and click Check.
If your website runs on a supported platform, you should be able to set up the pixel easily without having to edit your website's code. Click Next and follow the on-screen instructions.
Note: If a partner integration is unavailable, continue to click Next. The next step offers two choices to connect your data with Meta: Get guidance or Do it yourself. Whichever option you choose, follow the on-screen instructions.
3) Configure events and conversions on Facebook
You're almost done.
Set up your ad (e.g., objective, campaign ad name, ad set name) accordingly.
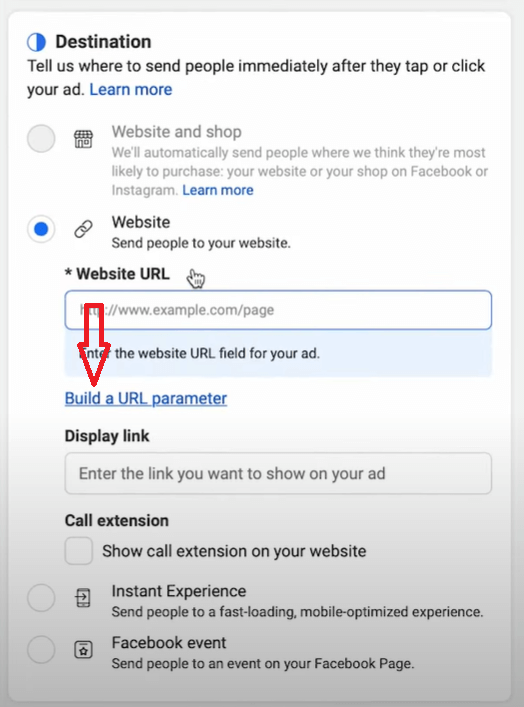
Scroll down till you see Destination.
Click the built-in campaign URL builder to customize your destination URL with parameters.
(Recap: Parameters are snippets of code added to the end of a URL link. They're used to track campaign performance.)
Here are the URL parameters you’ll come across:
- Campaign source: The platform you’re running ads
- Campaign medium: The marketing medium
- Campaign name: The name of the Facebook campaign
- Campaign content: The ad name
Let's say your website is ecommerce.com, Facebook Ads campaign name is Summer Q22024, and ad name is Dresses.
Your URL will appear as:
https://ecommerce.com?utm_source=Facebook&utm_medium=paid&utm_campaign=SummerQ22024&utm_content=Dresses
Cool, huh?
By using these campaign UTM parameters, you have a better understanding of where traffic and conversions come from—right down to the individual ads.
4) Track Meta Ads in Google Analytics 4
Go back to your Google Analytics account.
On the left menu, click Acquisition > Traffic Acquisition.
Scroll down and click the Session default channel group dropdown menu > Session source/medium. You’ll see a list of traffic sources, including Facebook traffic, alongside the number of users, sessions, etc.
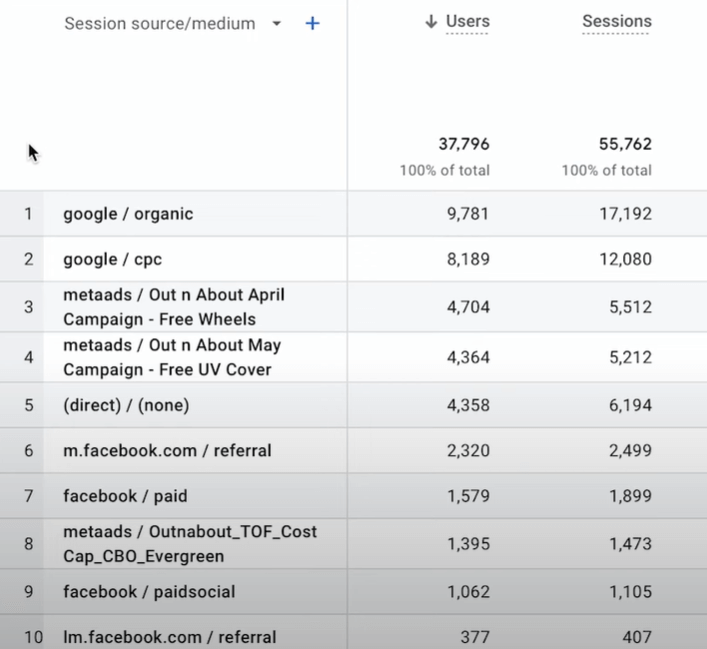
Notice the parameter values dynamically filled in?
Here you can quickly stack up your top-performing ads against each other, drilling down the metrics that matter most to you.
And voila, you're done.
Top 5 Metrics to Track for Facebook Ads If You Don’t Know Where to Begin
Are your ads compelling users to take action? If they're not, measure these metrics to get them on track.
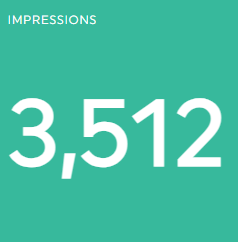
1. Impressions and reach
What it is:
Impressions refer to the number of times your ad is shown on screen for the first time. Whereas reach is the number of users who saw your ad at least once.
Note: Impressions include multiple views of your ad by the same users.
How to improve it today:
- Test ad creatives
Since Facebook prioritizes ads based on creative quality, avoid stock images and generic copy. Basically, any visual or written content where users unconsciously ignore them.
“These don’t resonate as deeply with audiences,” says Elisa Montanari, Head of Organic Growth at Wrike. “So using them might get your ad deprioritized.”
Your best bet? Choosing an ad creative that accurately conveys your USP and helps prospective customers visualize themselves with your product.
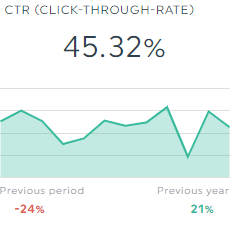
2. Click-through rate (CTR)
What it is:
Percentage of clicks your ad receives from all Facebook users who see it
How to improve it today:
- Apply voice of customer (VoC) data
Use your customers’ words verbatim to evoke emotions.
Interview customers to uncover their challenges and desires:
- “How do you use [Product] in your work?”
- “What’s the NO.1 benefit you received from [Product]?”
- “How do you describe [Product] to people?”
Pay attention to the most common answers in your ad copy.
Suppose early users for a collaborative writing software describe it as a “better alternative to Google Docs,” thanks to its “distraction-free writing environment.”
Highlight these phrases in the ad headline and text overlay to drive the value prop home. If it strikes a chord in existing users, it’ll likely do the same for prospective customers.
3. Cost per click (CPC)
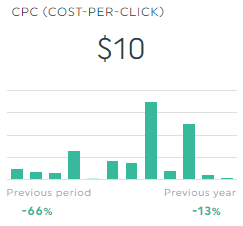
What it is:
The cost you pay for each click on average
How to improve it today:
- Master the daily budget game
When Motivosity noticed its CPC increasing, it did two things:
- Set a limit on its CPC budget
- Increase the budget by 10 cents at a time till it “found the sweet spot between budget and impressions”
“You don’t want an ad spend so low that you lose impressions,” says Logan Mallory, the Vice President of Marketing. “But you also don’t want to overpay for clicks unnecessarily.”
This tactic helps you get the best of both worlds.
4. Conversion rate (CVR)
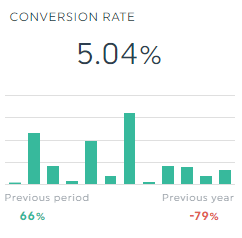
What it is:
Percentage of users who completed a desired action from all users who visited your site
How to improve it today:
- Remove ALL friction on destination page
Poorly optimized sites result in low CVRs.
And they're usually caused by friction points like the ones below. Fortunately, you can easily solve them:
- Cluttered landing page >>> remove unnecessary navigation to prevent turning users away from your conversion goal
- Slow page load >>> install a cache and optimization plugin to speed up your website
- Lack of trust >>> include trust boosters like money-back guarantee and testimonials
5. Return on Ad Spend (ROAS)
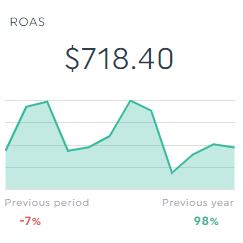
What it is:
Total revenue generated from your Facebook ads divided by total ad spend
How to improve it today:
- TEST!
An ad with a 900% ROAS can drop to 200 in a matter of days.
Run new ads.
Keep an eye out for trends.
And continue to test.
For example:
- Research customers every quarter to stay on top of expectations and demand. And use their words verbatim in your ad copy.
- Experiment with different copywriting formulas (e.g., AIDA) in your headline, description, and primary text
- Run your legacy static image ads during big sales. Test them against unedited videos sent by customers.
DashThis: An Alternative for Breezy Reporting
DashThis is the easiest reporting tool.
Instead of analyzing your ad campaigns in the endless rows and columns on GA4, gather your entire data automatically into one beautiful Facebook Ads report.
Just connect your GA4 and Meta accounts once, and let it do the rest.
Take the dashboard below.
Notice how easy it is to analyze your overall Facebook Ads campaign performance in a single interface?
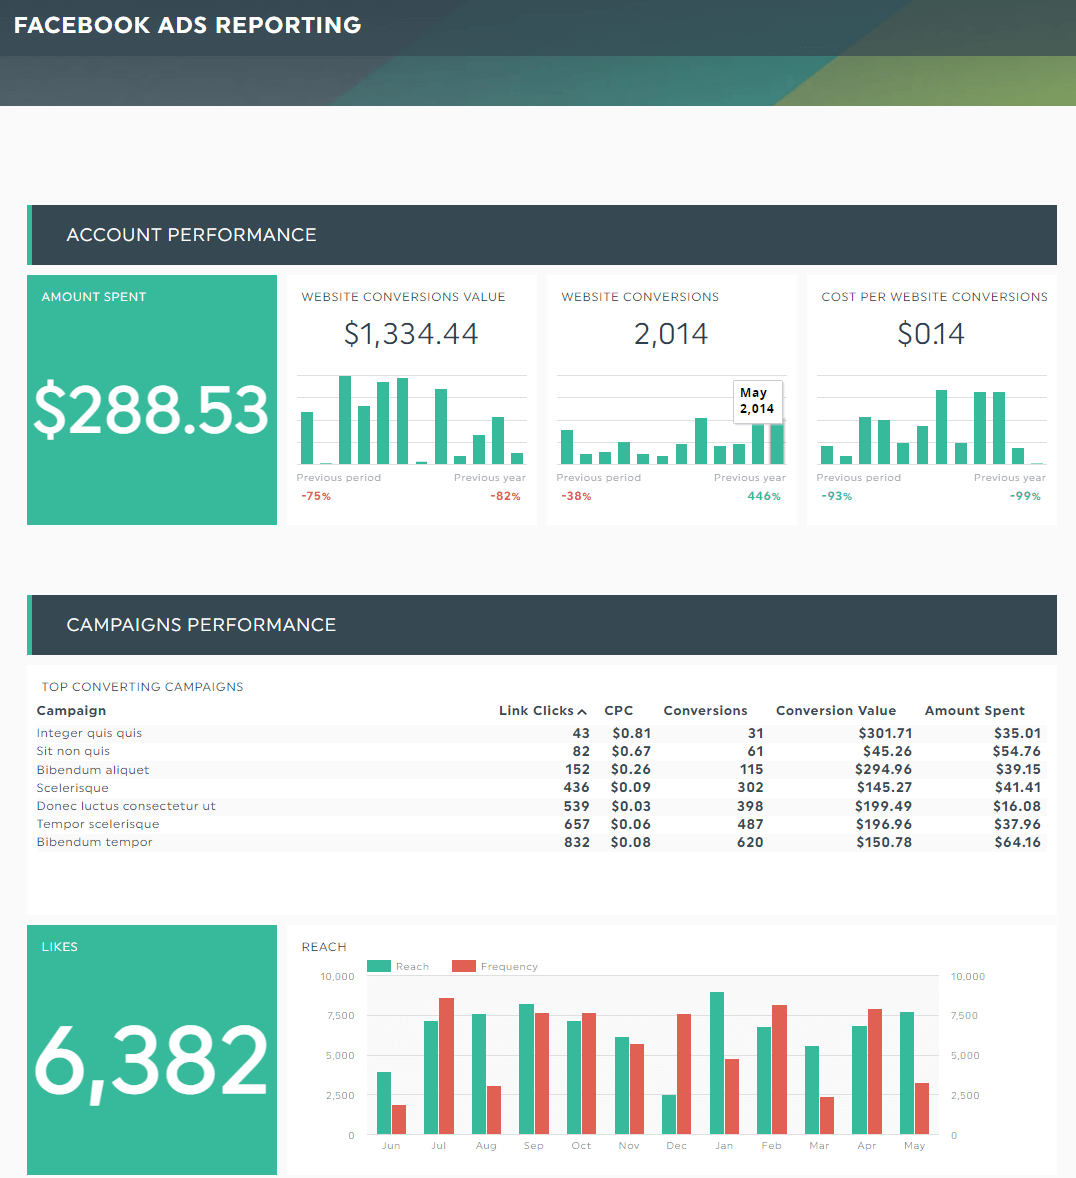
This makes extracting insights breezy, freeing up time for value-added activities like tapping into a fresh market of clients, collaborating on more ideas, and strategizing the next move.
Facebook Ads agencies that automate their reports on DashThis also enjoy features like:
- Native integration with 40+ popular marketing tools
- Unlimited users, client accounts, and data sources in all plans
- 40+ beautiful report templates with pre-built popular metrics
- Built-in notes to provide additional context for specific metrics
- …and more
Start your free 15-day trial to automate your Facebook Ads reports today.
How to Auto-Create a Facebook Advertising Report on DashThis
Here’s how it works:
- Connect your Facebook Ads account with DashThis
- Select the Facebook Ads report template
- Choose your metrics in Preset Widget
DashThis will grab the entire Facebook Ads KPIs from your account into the report automatically. Drag and drop them to form a cohesive look.
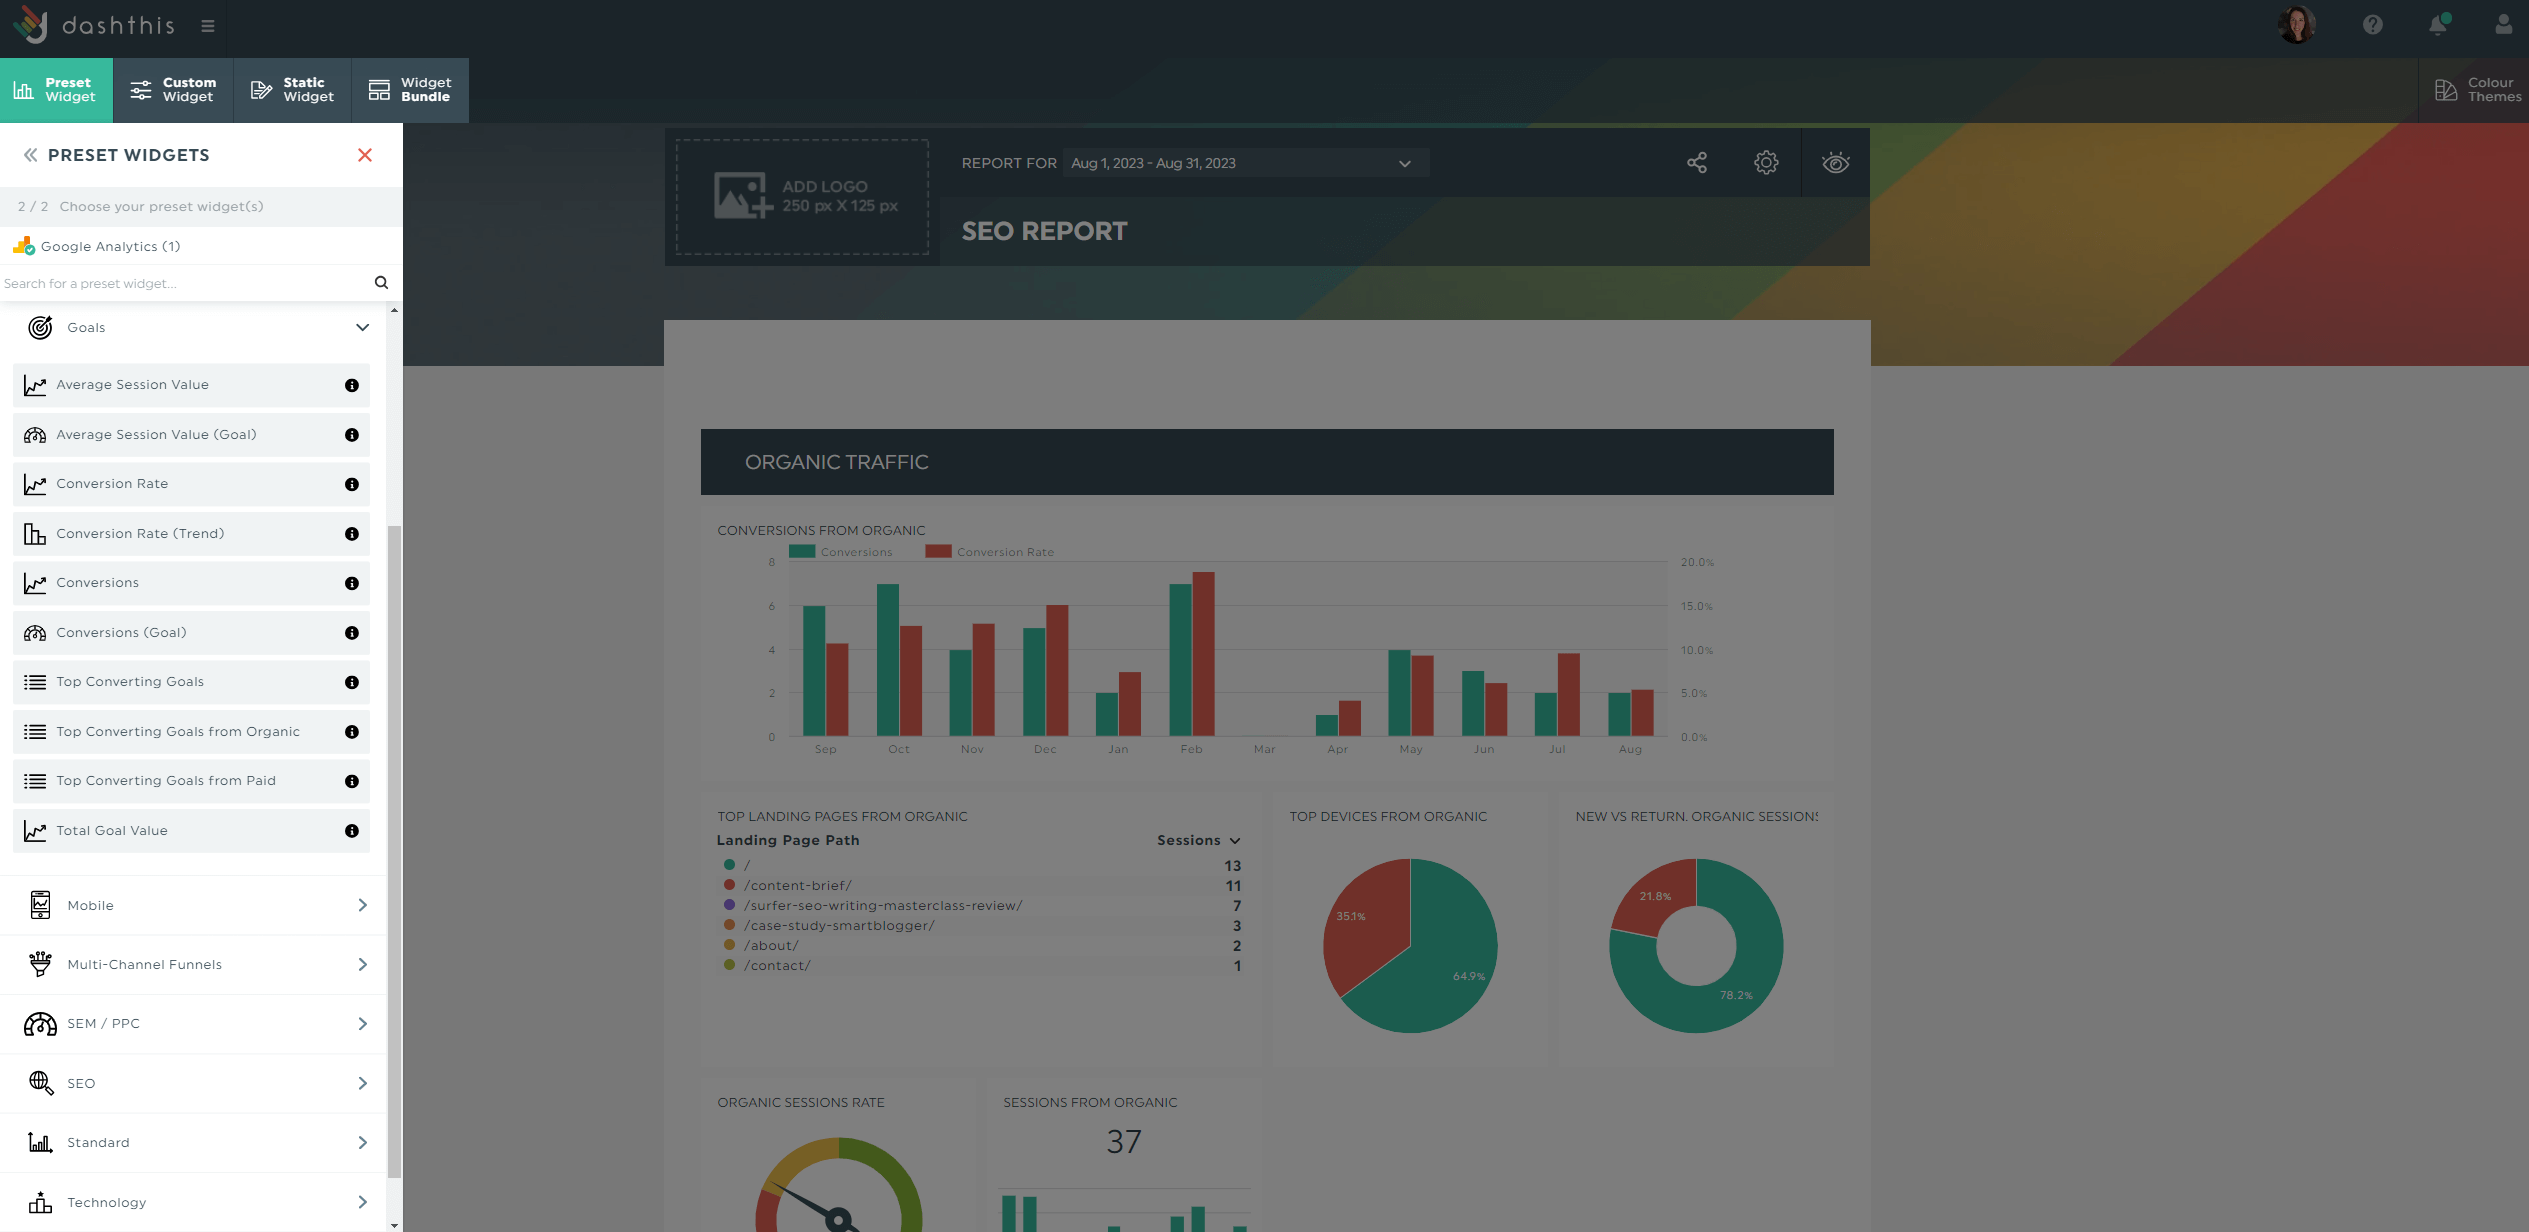
Customize your Facebook Ads dashboard.
Let’s say you’re seeing unexpected conversions from an unedited user-generated video for an eCommerce client. To boost conversions, you want to turn it into an ad.
To make your case to the client, try our comment widget. Click Static Widget > Comment and share what you have in mind directly in the report.
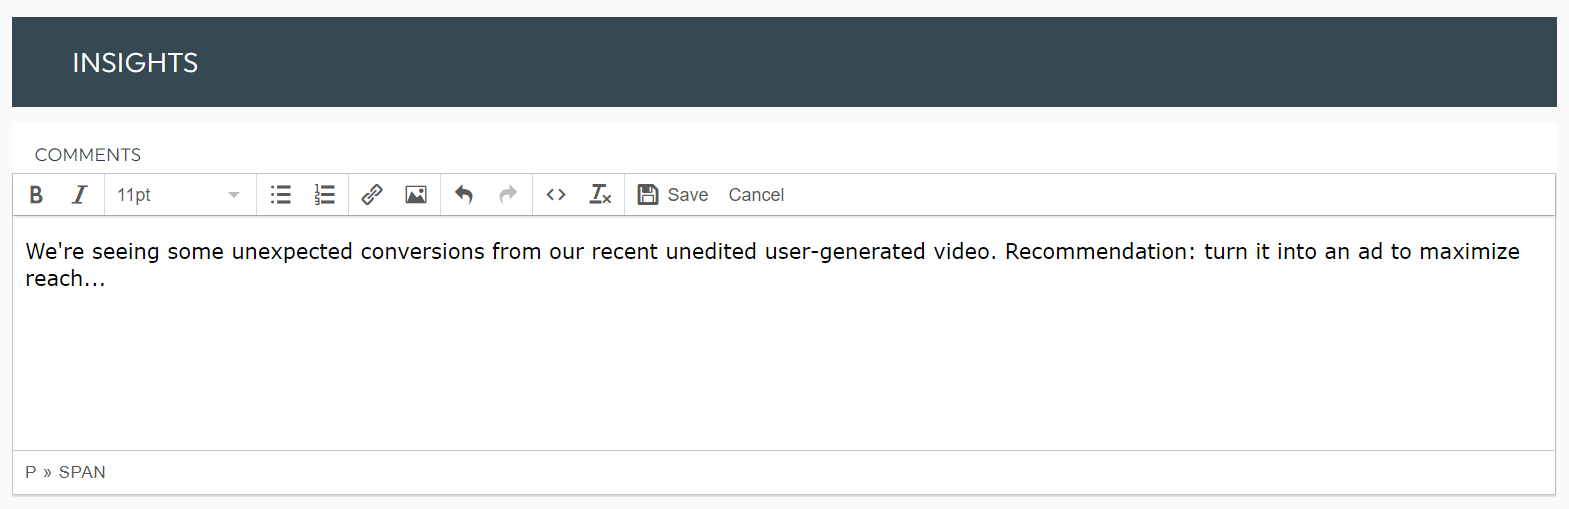
Click Save.
On the other hand, if you want to include micro explanations, like:
- Defining metrics like Facebook engagement rate to clients with zero marketing expertise
- Providing context for erratic graphs and charts
- Explaining what a specific data point means (e.g., sudden dip in traffic in June caused by X factors)...
…then use our built-in notes widget.
Hover to a metric you desire and click the dropdown menu > Add Note.
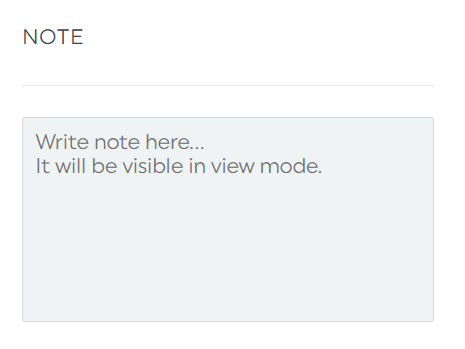
Click Save after you’re done.
This note will appear as an orange tab in view mode.
Once you’re done customizing the report, schedule an automated email dispatch:
- Hover to the Sharing Options icon on the top right
- Click Share by Email
- Set the dashboard period and frequency
- Click Schedule
Add an optional note and include the report as a PDF attachment.
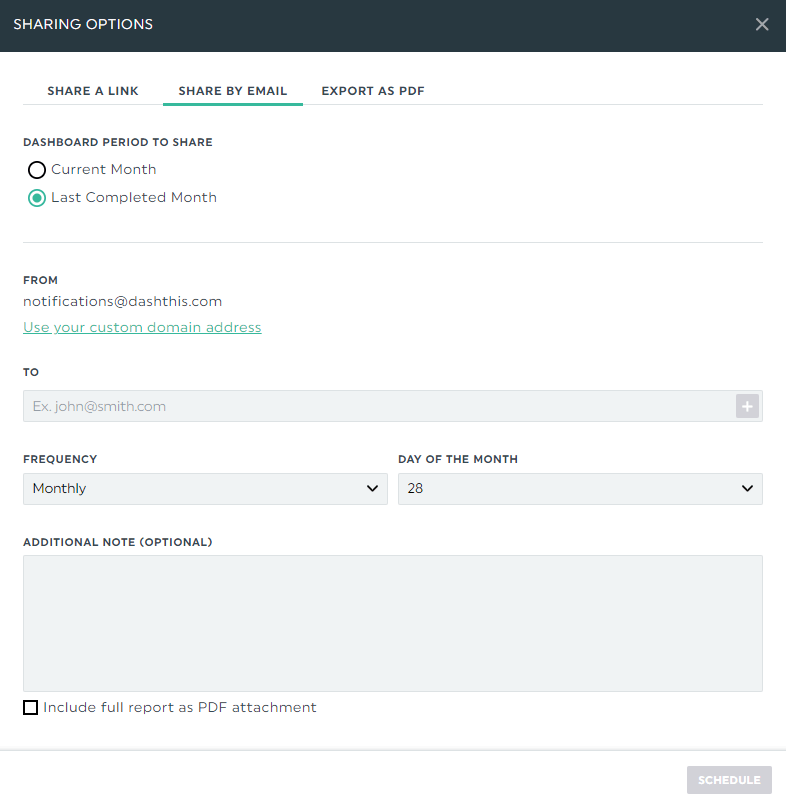
Alternatively, send over the report via a shareable URL link.
Facebook Ads report template
Ad issues can run anywhere from audience targeting to creatives.
This complete Facebook marketing campaign report, which gathers all crucial analytics data (e.g., ads reach for specific ads, link clicks per post), helps you narrow down the root cause.
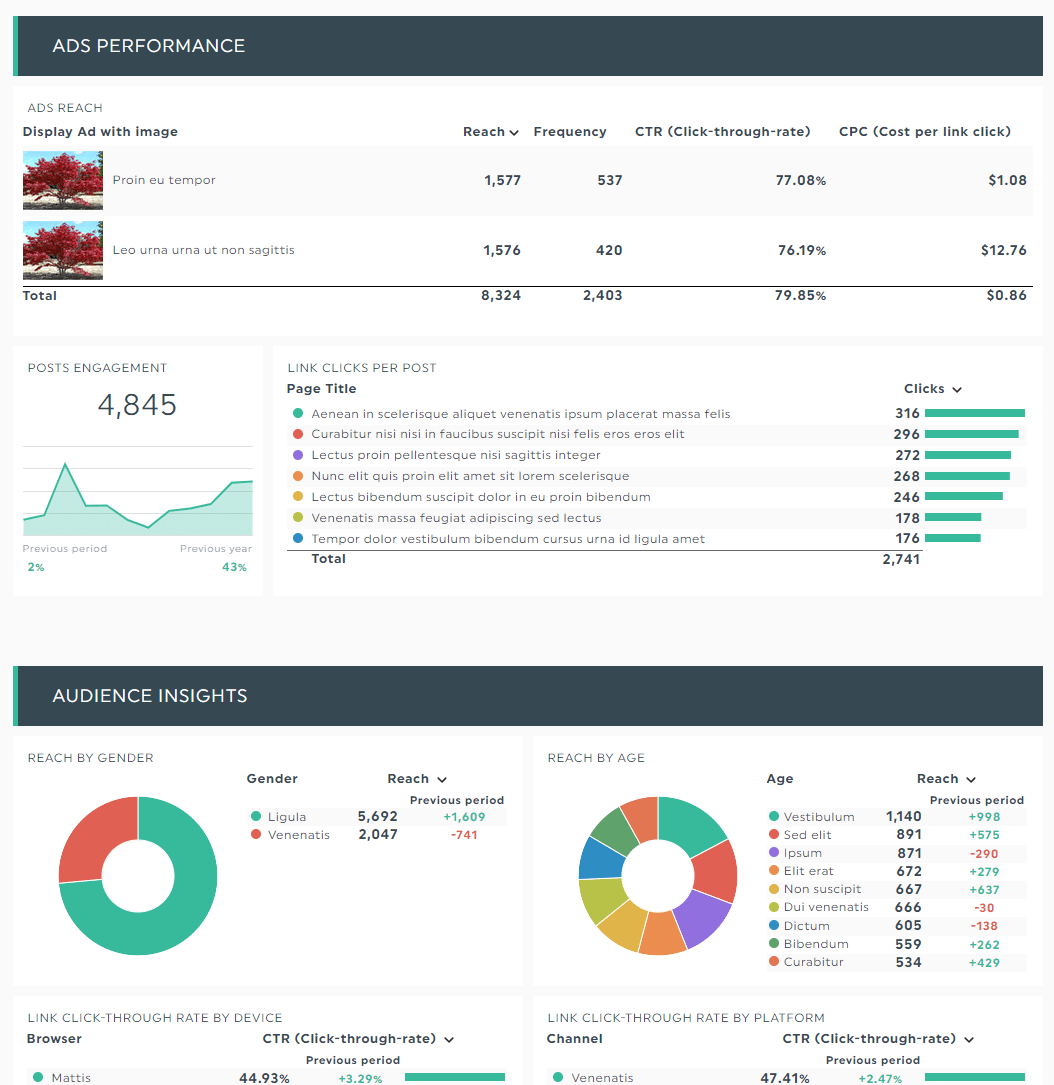
Grab this Facebook Ad performance report template with your own data!
Automate Your Facebook Ads Reporting with DashThis Today!
There’s no 100% accurate attribution.
Your best move is to add UTM parameters at the end of your destination URLs. You’ll have a much clearer picture of your ads and website conversions this way.
Consider tracking your Facebook Ads campaigns on DashThis while you're at it.
With all metrics in a single interface, you can quickly spot growth opportunities and gain back hours of your time.
DashThis is the easiest reporting tool. Automatically gather your entire data across multiple campaigns, ad sets, and ads into one beautiful report.

Want to track your Facebook ads and GA4 data in one slick, easy-to-use dashboard?
Read More

Don’t miss out!
Follow us on social media to stay tuned!
Automate your reports!
Bring all your marketing data into one automated report.
Try dashthis for free