Web Analytics Reporting Guide - Software, Metrics & Dashboard Template

Recent changes between UA and GA4 make accessing metrics more difficult.
The bounce rate is gone (poof!), and so are goal completions (adios!) and e-commerce transactions (say what?!).
It’s going to take a long, long time to re-learn GA.
This brief guide covers what's changed in your favorite metrics and the best way to measure your web analytics reporting on this next generation of Google Analytics.
- What is Web Analytics?
- Why Web Analytics is so Important
- Web Analytics Metrics: What You Should Include in Your Reports
- How to Track Your Web Analytics Reporting with DashThis
- Automate Your Reporting
What is Web Analytics?
Web analytics refers to the key metrics that measure your website’s overall performance.
Why Web Analytics is So Important
Analytics tells you what’s going on in your website accurately.
It provides the vital data you need to hit your goals, whether it's ranking on the SERPs, generating leads, attracting sales, or all the above.
On a deeper level, web analytics reporting also helps you to:
- Catch potential bugs ahead of time: Quickly jump in to solve a technical error before it worsens. For example, if the ad campaigns on your social media channels appear to drive thousands of website visitors, but you can track only a dozen, that could signal an implementation or page loading error. Better fix it now than wait for the next quarter!
- Optimize only what works: Know exactly which campaigns to double down on with zero guesswork. Web analytics reports help you make data-driven decisions instead of relying on your gut.
- Get buy-in for future marketing campaigns: Brands want to work with agencies that measure success by conversions, not traffic. Identify the SEO keywords, email marketing campaigns, etc. that make the biggest impact on revenue and back them up with data when presenting to stakeholders.
Web Analytics Tools
Your website performance determines the next quarter’s marketing strategies. Here are the three primary web analytics tools every marketer should use to unearth potential issues and opportunities for optimization.
(i) Google Analytics 4
GA4 tracks your website data and user experience in real-time for free. Integrate it with a heat maps analytics tool (like Hotjar) to understand the “why” behind user interactions. Better yet, conduct customer interviews to gain a complete picture.
(ii) Google Search Console
Google Search Console (GSC) is a free tool that troubleshoots technical errors (e.g., broken links, crawled pages) and improves site visibility on the SERPs.
Another relevant tool is Google My Business (GMB), a free business profile that connects you with customers.
(iii) Reporting tools
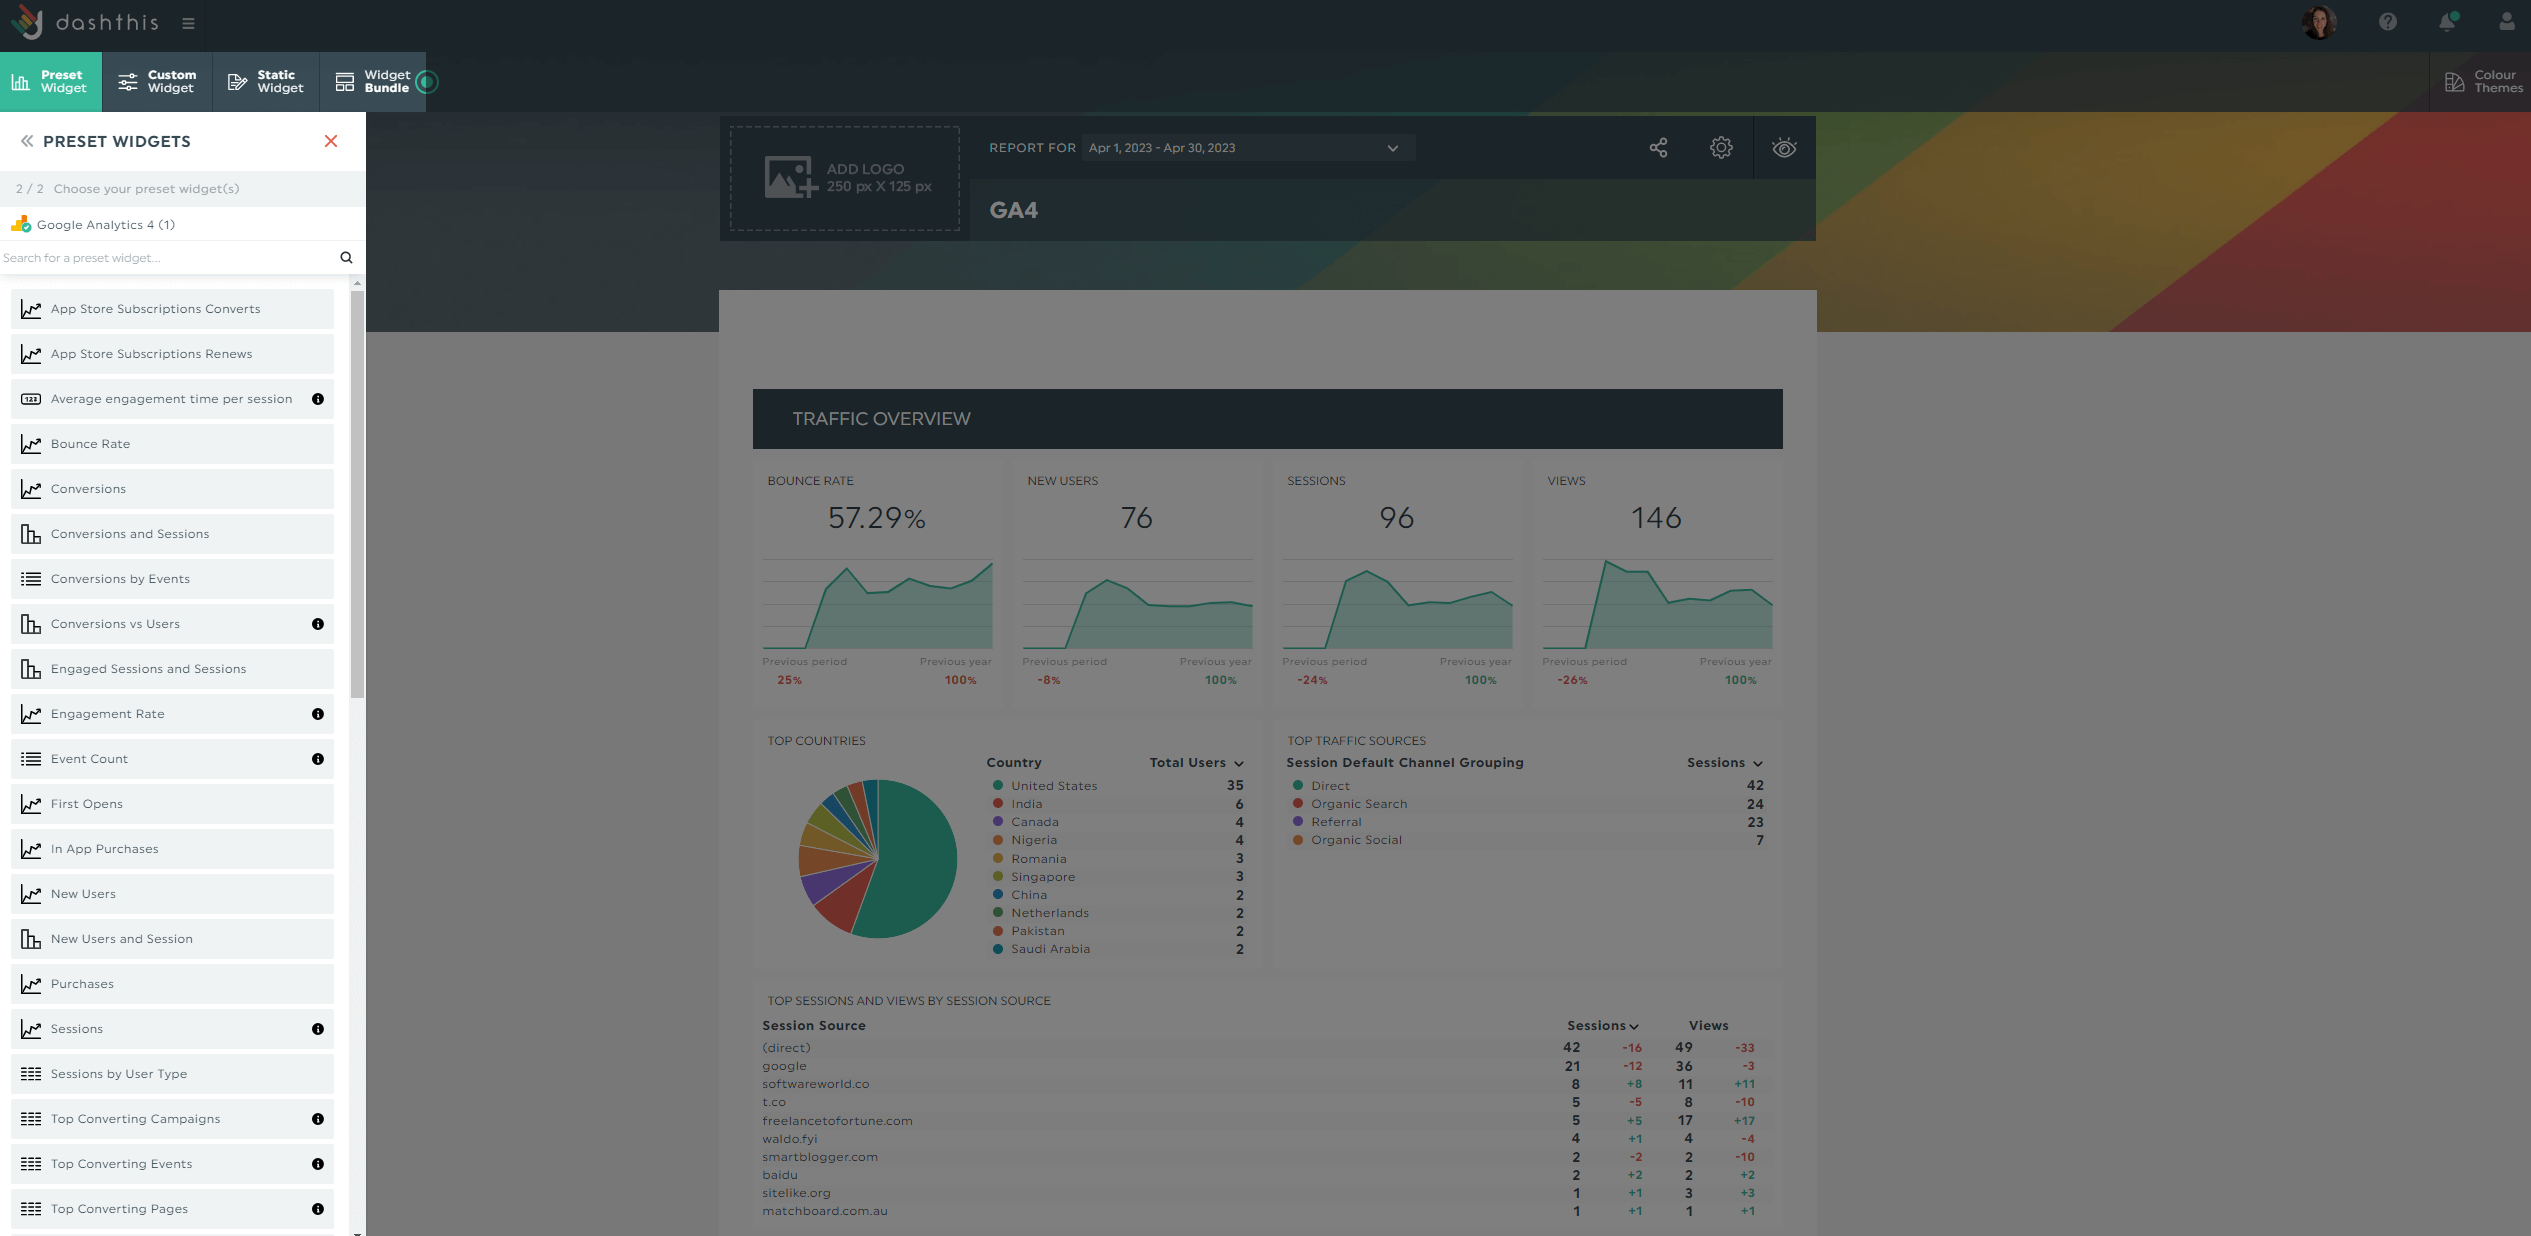
Reporting tools transform raw data into easy-to-understand visuals automatically. It's a gamechanger for time-starved stakeholders. For example, note the visualization-focused GA4 report auto-generated on DashThis below.

At just a glance, you can instantly see the impact of your marketing efforts in a specific date range.
Gather data from multiple marketing channels into one beautiful report. DashThis is an automated marketing reporting tool that helps you create dashboards in the blink of an eye. Start your free 15-day trial to gain back hours of your time today.
Web Analytics Metrics: What You Should Include in Your Reports
These metrics monitor how close you are to hitting the key performance indicators (KPIs) in your digital marketing campaigns. Include them in your analytics data report to track your site’s performance.
Visitor metrics
The users metrics track the number of visitors who interact with your website.
Here’s how GA4 defines them:
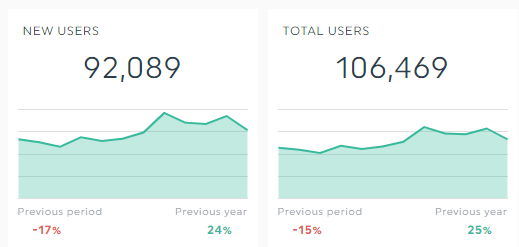
Total users: The total number of unique users who logged an event (e.g., viewed a page, signed up for a newsletter).
New users: The number of users who interacted with your website for the first time (measured by the number of new unique user IDs).
Active users: The number of engaged users who visited your website. This is a new and primary user metric in GA4.
Open the demographics tab on GA4 to dig deeper into your visitors’ age, country, gender, and interests, and update your buyer persona accordingly.
Traffic sources
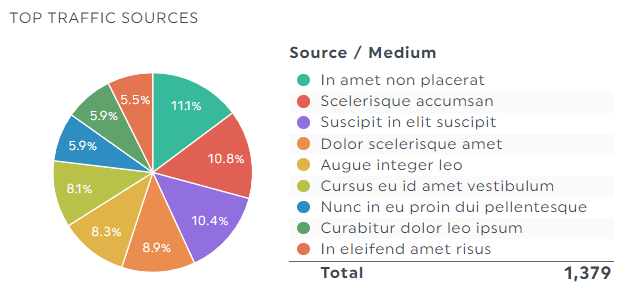
Website traffic sources refer to the sources that drive users to your website (e.g., direct traffic, referral traffic, paid search, organic search).
Average session duration

Average session duration measures the total duration of all engaged sessions divided by the number of sessions.
Don’t skip this metric when gauging user behavior on web pages. It tells you if visitors are engaged with your content.
GA4 determines an engaged session when a user visits a page for 10 seconds or longer. A user visit with one or more conversion events, or two or more page views also counts as an engaged session (note: there’s no bounce rate in the new Google Analytics. GA4 counts a session as a bounce when visitors fail to meet the criteria above).
Page views

Page views refers to the total number of pages viewed on a website (note: in GA4, page views is now measured as an “enhanced event”).
Conversion rate

Conversions rate refers to the percentage of visitors who have completed a desired action on a website. This metric helps you determine the success of your marketing efforts (note: GA4 measures all conversions as GA4 events, not goals and ecommerce transactions).
How to Track Your Web Analytics Reporting with DashThis
With over 100 metrics scattered across multiple tabs on GA4, it can be challenging to navigate the dashboard to access them.
And this is only one analytics account we’re talking about here.
What does it look like for an online marketing agency that handles dozens of accounts? It’s not pretty. *shivers*
If you’re wondering how to speed up web analytics reporting on GA4 across the entire client base without losing more hours of your time, look no further than DashThis.
Here’s how it works:
- Select a GA4 template
- Connect your GA4 account with DashThis (note: you can also connect with other data sources within the same template. DashThis currently supports 40+ integrations with your favorite marketing tools)
- Choose your metrics in Preset Widgets
DashThis will proceed to gather the metrics you selected into the report. Drag and drop the graphs as you desire.
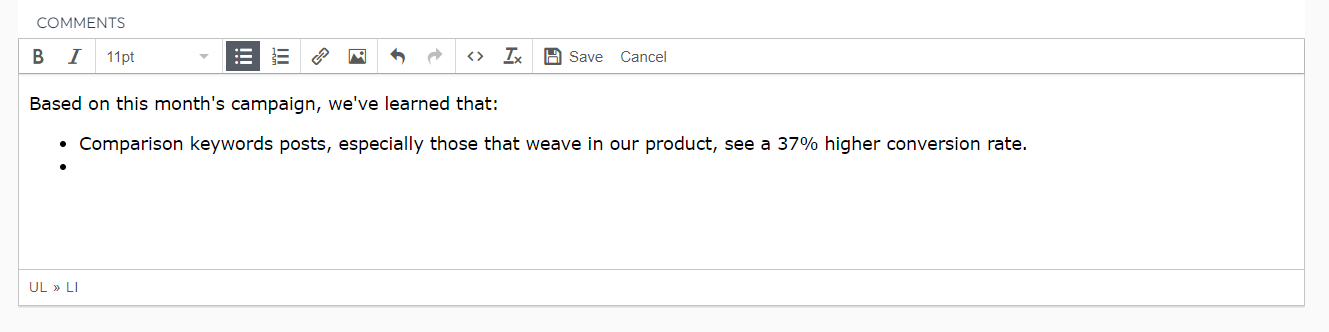
Quickly share your actionable insights with stakeholders within the report. Click Static Widgets > Add Comment to include your recommendations for the next quarter’s campaign.
Once you’re finished, schedule an automatic email dispatch to all stakeholders within the dashboard editor. You can even set your preferred time frame.
Start your free 15-day trial on DashThis to speed up your web analytics reporting on GA4 today.
GA4 report template
GA4 is a gigantic web analytics tool.
Try this report to visualize how unique visitors stack up against returning visitors, which content performs best on the search engine, users on desktop vs. mobile devices, and more.
Grab this GA4 web traffic report with your own data!
Web analytics report template
It’s the classic battle between PPC and organic traffic. Use this powerhouse dashboard template to analyze how your Google Ads and landing pages contribute to revenue.

Grab this website analytics report with your own data!
Automate Your Reporting
Measuring your web analytics on GA4 is like getting a full medical check-up.
It detects potentially business-threatening issues, increases your chance for ranking on the SERPs, and gets the most out of your marketing efforts.
Start measuring these metrics to improve your site performance today.
DashThis is an automated marketing reporting tool. Pricing starts at $44/month when billed annually. Start your free 15-day trial to create dashboards in the blink of an eye and gain back hours of your time today.

Track your web analytics data with Dashthis
Read More

Don’t miss out!
Follow us on social media to stay tuned!
Automate your reports!
Bring all your marketing data into one automated report.
Try dashthis for free