Facebook Insights Explained: Facebook Page Views, Post Impressions & More

Facebook’s free metrics tool - Facebook Insights, gives marketers a powerful platform to measure the performance of the pages they manage and the Facebook posts they create.
Navigating Facebook Insights and its abundance of data and insights can be overwhelming initially, as users need clear guidance on leveraging it effectively for their Facebook marketing efforts. This is where our expertise comes into play, as we assist in deciphering the intricacies of the algorithm and employing social media analytics to extract actionable insights, ensuring optimized outcomes for your Facebook marketing campaigns.
Below you will find each Facebook metric clearly explained and reasons why you may wish to add one to your marketing report.
Overview tab
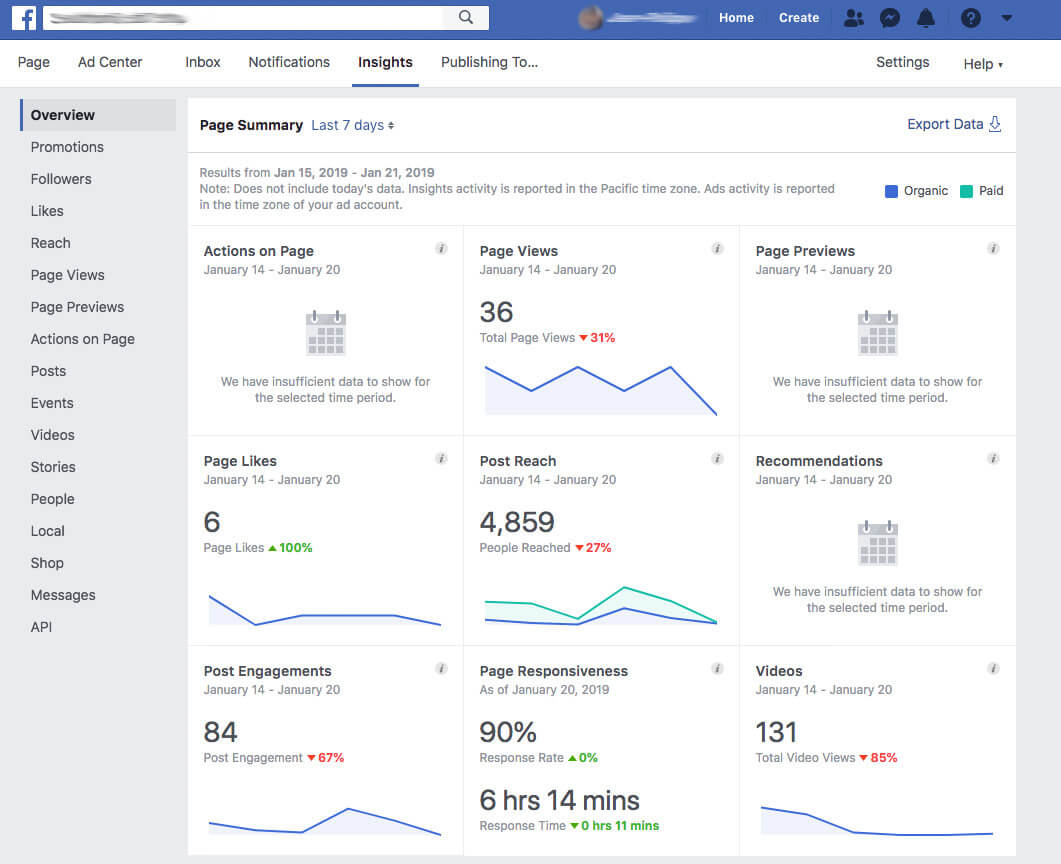
The overview tab is the first part of Facebook Insights you’ll land on when you’re looking to track your progress, and it shows a brief but useful selection of important metrics. You might not always have time to analyze your stats thoroughly, so this is the quickest and best way to see how things are generally going.
The overview section comprises a grid of data, including page actions, post reach, and post engagements, and its highly visual layout means you can easily keep track of trends within your stats. Most of the metrics on the page are displayed in a line graph format and have highlighted percentage changes - a couple of minutes of looking through will bring you to speed with just how positive or negative things on your page are going.
There are options to change the period of data you view at the top of the page, meaning you can look at trending graphs from today, yesterday, the last seven days, or the last 28 days. Once you’ve selected your timeframe, you can export the overview of data in various formats, perfect for sending a quick update to someone or attaching it to a report.
However, this data isn’t always enough. Looking through more specific elements of your Facebook page is crucial when trying to get your social media campaign running efficiently, and that’s where the next tabs come in.
Likes tab
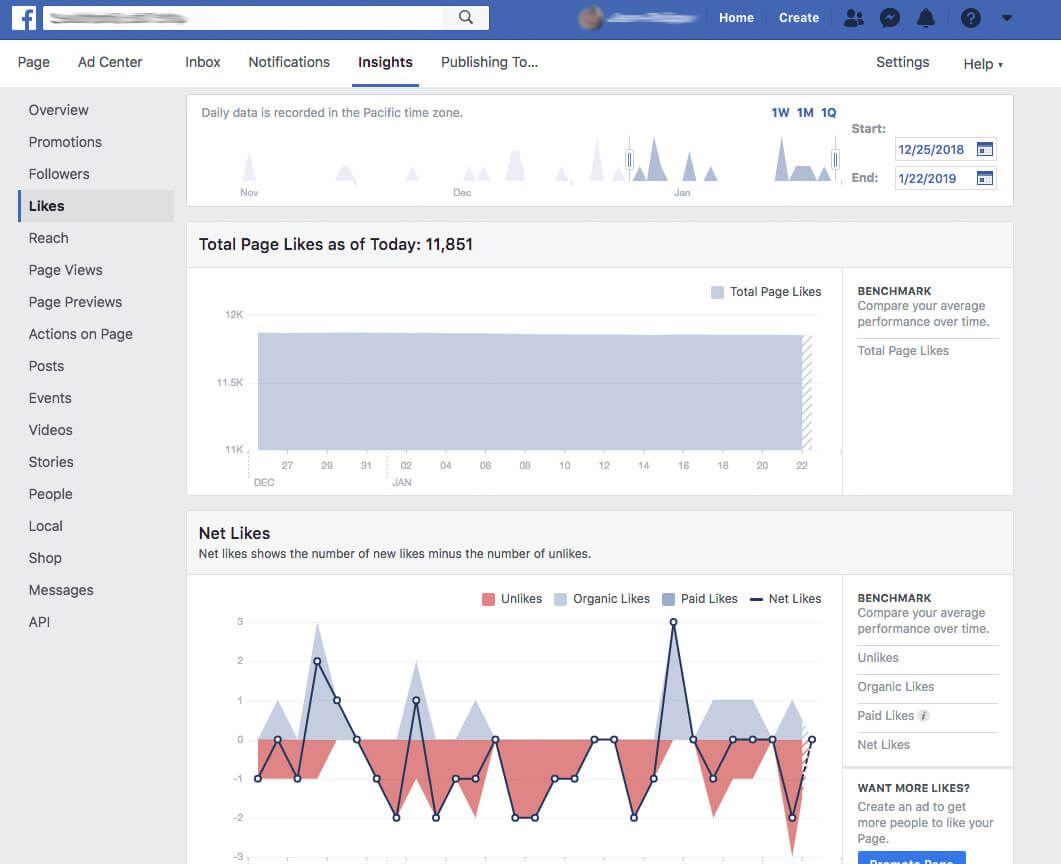
Page Likes
Page likes are the number of people who support your page, are interested in what you’ve got to offer, and want to see what you’re posting.
Why track Page Likes?
The number of likes a page has very much contributes to how people measure a brand or business’s authenticity, i.e., the more likes, the more reputable it must be, right?
While it’s very much viewed as an image-boosting factor, increasing your page likes is also a great benefit - your content will reach more people. Therefore, you should track your page likes over time, intending to see that number grow. If your page likes aren’t increasing, you should look at revising your content strategy, both paid and organic.
Net Likes
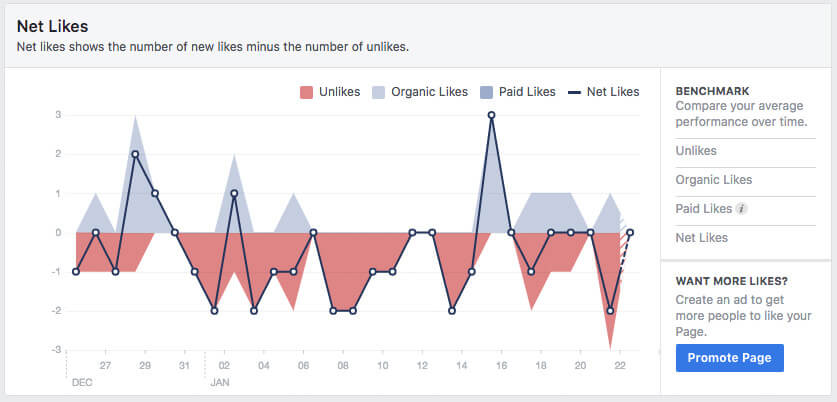
This shows the overall trend of your page’s likes, measuring the number of new likes minus the number of unlikes. If you’ve been running Facebook promotions or ads, you’ll also be able to see the number of paid likes gained from this here.
Why track Net Likes?
When simply tracking your overall page likes, you might not see any changes day-to-day. However, when looking at your net likes, you may find that you are bringing in new fans but also losing as many as you’re gaining, halting your page growth. While some unlikes are due to Facebook deleting unused accounts, it’s good to get an idea of your page, unlike stats, as it could become a cause for concern if people aren’t sticking around for your content.
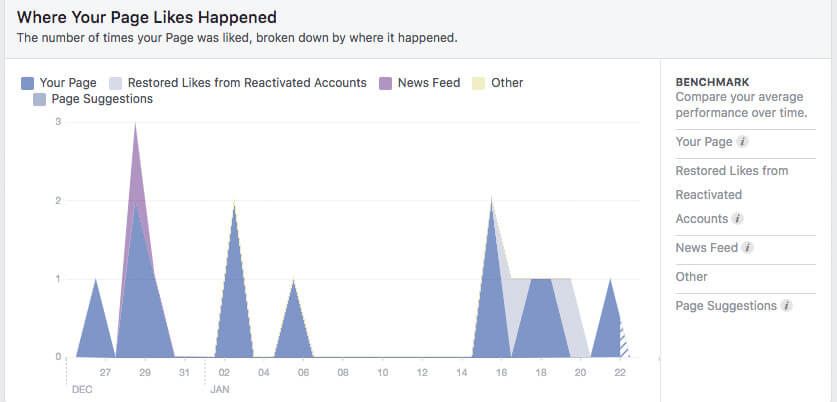
Where your page likes happened
This provides a useful insight into where exactly your new page Likes have come from, which could be any of the following: Ads, Page suggestions, News Feed, Your Page, Search or Restored Likes from reactivated accounts.
Why is this important?
It’s good to know how your fans found you. This can indicate your visibility on Facebook and how your paid content measures up against your organic. The information can be used to analyze how you perform in particular areas and can be used to shape your future social media marketing strategies.
Reach tab
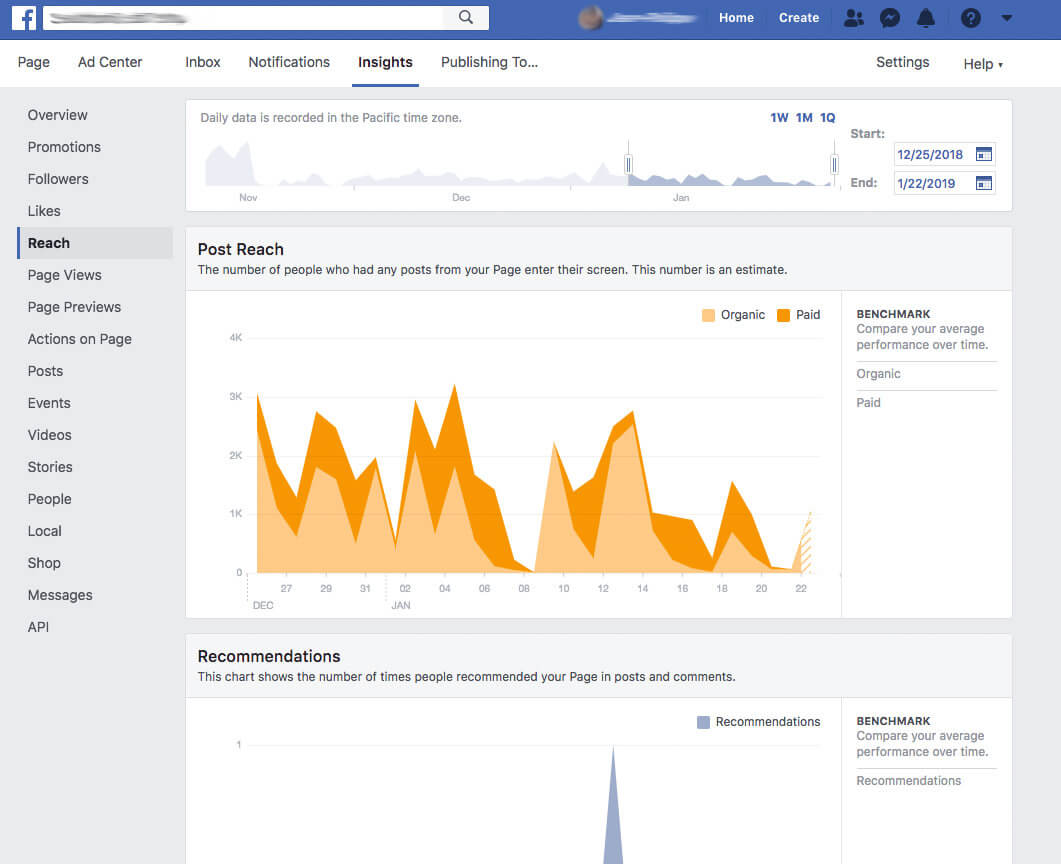
Post reach
This shows you how many people your posts have reached i.e. when any post from your page has appeared on their screen. This measures the reach for both your organic content and paid promotions, displayed definitively in the graph.
Why should you measure post reach?
When you’re posting high-quality content, you want people to see it. So it’s useful to track your reach over time to see the growth of your content, or if there is none, you can take appropriate action. It’s also a quick way to see if your ads are working.
Reactions, comments, shares and more
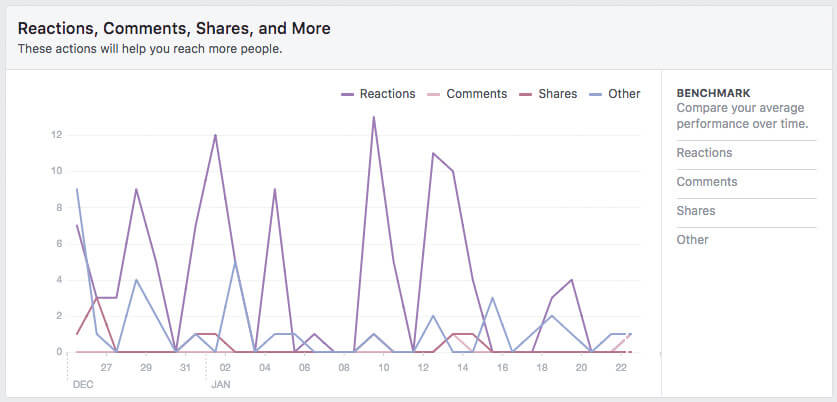
This is different to post reach and shows the number of people who have seen any activity from your page, such as your content, ads, check-ins, or any mentions about your page.
Why should you measure total reach?
This is a great way to measure the success of your organic and paid content and clearly indicates how your page is growing over time.
Impressions
Impressions refer to the number of times a post or ad is displayed on Facebook users' screens, serving as a key metric in evaluating brand awareness, Facebook engagement, and the effectiveness of Facebook advertising campaigns.
Why should you measure Facebook impressions?
Measuring Facebook impressions is crucial for several reasons. Firstly, it provides valuable insights into the reach and exposure of your ads or content, allowing you to assess the effectiveness of your marketing campaigns. Secondly, by comparing your impressions against benchmarks or industry standards, you can gauge the performance of your ads about competitors. Tracking ad impression metrics through tools like Facebook Ads Manager enables you to optimize your targeting, ad placement, and content strategy to maximize your reach and engagement with the target audience.
Visits tab
Page and Tab Visits
Page and Tab Visits give you an insight into the total number of times each of a page’s Tabs was viewed over a period of time.
There is a wide range of Page Tabs, including Posts, Events, Photos, Videos, Shop, Notes, About, Community, Info, and Ads.
Why track Tab Visits?
Facebook pages are set up for different reasons; some are created to promote events, while others are an extension of an ecommerce store. Here, you can track the Facebook traffic direct to the Tabs you use the most.
External Referrers
External Referrers provides data for the number of times users arrived at a Facebook page from a website outside of Facebook.
While direct traffic from inside Facebook will always make up the lion’s share of an audience, Facebook pages are often cited on external directories as part of company information.
Why track External Referrers?
As marketers, we can learn a lot from referral paths. This analysis gives us an idea of how impressionable a Facebook page is outside of Facebook itself.
Posts tab
When your fans are online
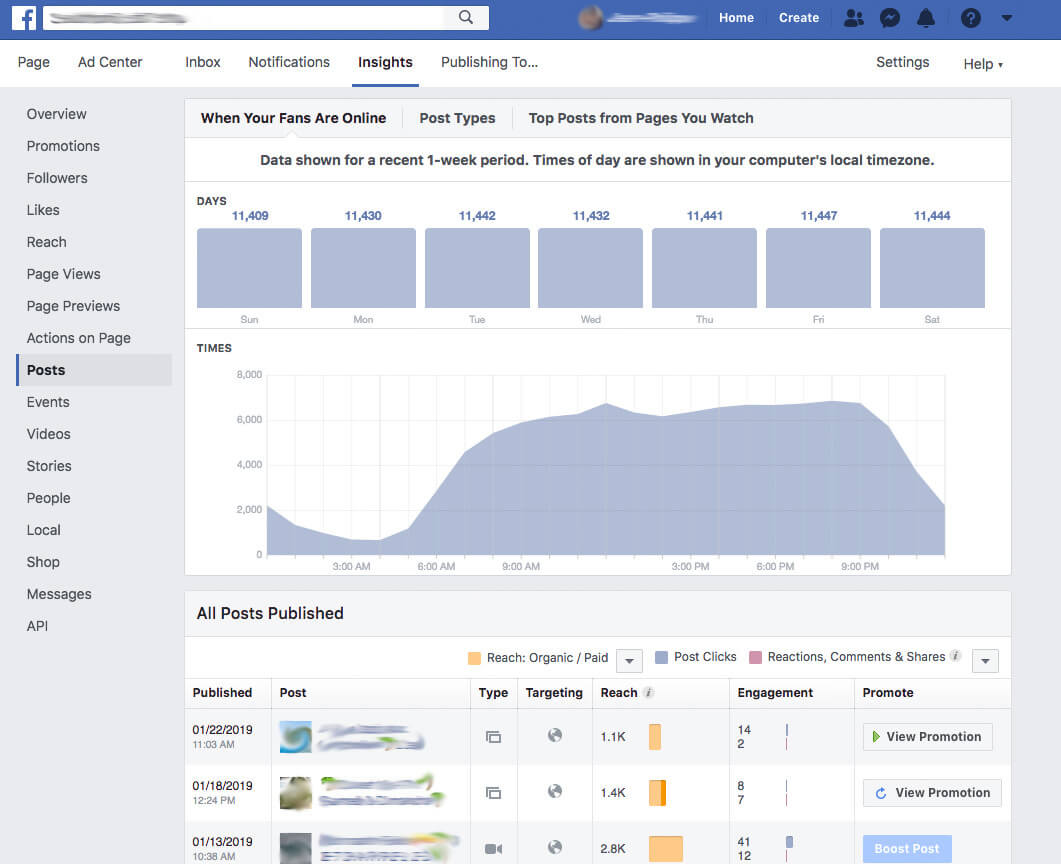
This section shows you information about your fans (those who like or follow your page), and the times they are online on Facebook. Although the date it will show isn’t customizable or from a specific time frame, it comes from a “recent” 1-week period, and Facebook gives no further hints as to just how recent it is. You don’t really need the specific dates the data is from, though, as the information still gives you a useful idea.
It gives you the exact number of your fans who were online on each day of the week, as well as a graph showing, on average, across the week, how many are online at each time of the day. Hover over the days above to see more specific graphs than the weekly average.
Why track this?
Of course, you want your posts to get the biggest reach possible - the more impressions, the better. It’s handy to know when you have a captive audience. Finding out when your fans are online is hugely beneficial. If your graph shows that, on average, 10% of your followers use Facebook at 1 pm but 60% are online at 4 pm, you wouldn’t be putting posts out at 1 pm anymore, instead trying to get them out to the much bigger audience three hours later.
Post types

This metric takes your posts and splits them into categories, with the most common ones being “Link”, “Photo” and “Video” - this is the primary content of your posts.
Splitting your posts into these categories shows you the average reach and engagement each type has received on your post, splitting the engagement metric into post clicks and other engagements (reactions, comments & shares).
How to use the Post Types data
A social media marketing campaign can sometimes be quite broad as you experiment with different post styles to determine what is most effective. The ‘Post Types’ insight section is a great way of tracking this. As it shows you which type of post gets the highest engagement rate and impressions, it enables you to focus your efforts on creating more piece of content of this kind.
Top posts from pages you watch
With this feature, Facebook encourages a bit of competitive research, which allows you to see how things have performed on other pages. To get started, you have to add pages to your watch list - you might have some competitors in mind, but if you don’t, Facebook suggests some of what it knows about your business when you open up the feature.
Once you have at least five pages on your watch list (you can add more than five if needed), it will show you what posts they’ve made this week, specifically filtering to their best-performing ones and showing how many engagements they received.
Tracking Facebook watched page posts
Similarly to tracking your own post type data, this type of analysis will help you choose what sort of posts you should be focusing on creating. You can gauge what is popular for similar businesses, but for the information to be truly beneficial, you must watch the right pages - make sure the sector, type of page, and location are all similar enough to your own to provide you with worthwhile data.
Video tab
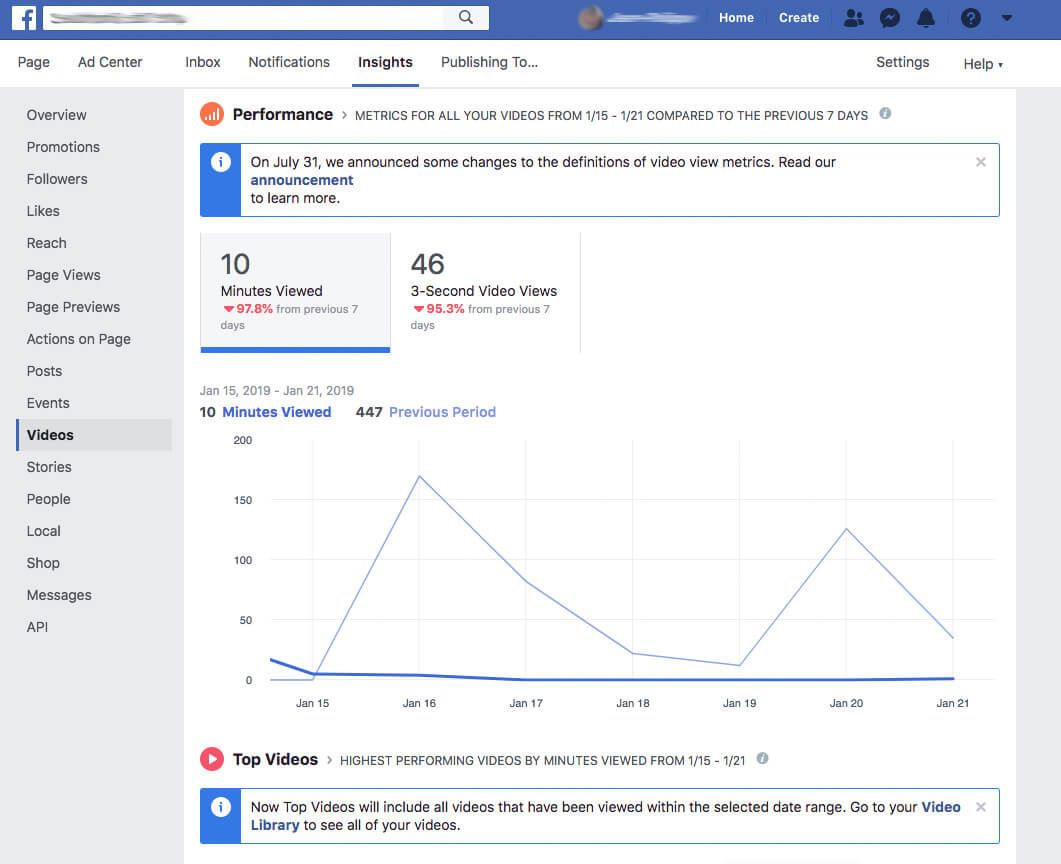
Performance
Video content is more important than ever, becoming one of the best ways to grab the attention of fans on social media. The performance section of this page will show you key Facebook metrics for videos you’ve recently shared, with this split into two primary trackable stats: total minutes viewed and a number of 3-second views.
The first stats show how long your video content has been viewed over a selected period, with the window completely customizable from a chosen start and end date.
The second stat shows how many times your videos have been viewed for at least three seconds, or 97% of its total length, if it has a shorter run time.
Tracking your video performance
This is the main way of judging how well your videos perform. If you’re getting a good number of viewed minutes, then your videos look to be grabbing the attention of Facebookers. This is a great KPI to include in a DashThis report to track your success with a video-focused social media campaign.
Top videos
This section shows which videos are performing the best on your page within the time period you’ve selected. With a list showing your videos in order of their ranked success, you’ll also see the date and time they were published, along with their total viewed minutes and 3-second views.
Analyzing your top Facebook videos
It’s good to see what’s making an impact, and looking through your top videos means you’ll see what sort of content garners the most views. Of course, this means you’ll know exactly what to post more of, while if you notice certain types of video aren’t appearing in your top videos, it’s time to stop wasting time making them and focus on a more beneficial format or topic.
People tab
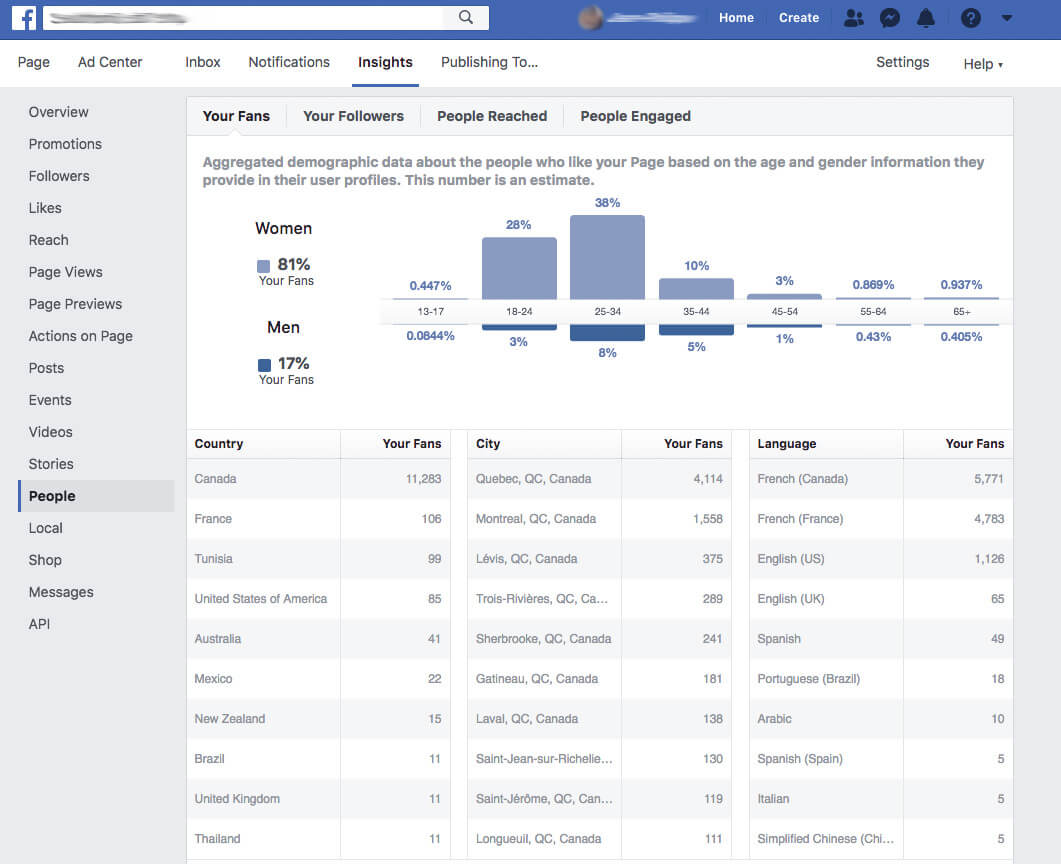
Your Fans
Fans offer valuable insight into the demographics of the people who like a Facebook page. Here, there is a breakdown of gender, age, location, and languages spoken.
Why track Your Fans?
Who doesn’t want to understand their own audience better? Any solid digital marketing campaign will have a clear and defined target audience, so this insight can help marketers to confirm that they are serving content to the right people.
People Reached
Not to be confused with the information on Post Reach above, People Reached is a broader data set that describes the number of people who viewed any content associated with the Facebook page.
It considers the reach of a Page’s posts and users that viewed photo albums, Stories, Reviews, etc. People Reached also includes users reached by any ad campaigns you may be running.
Why track People Reached?
Analyzing a page’s reach on a daily, weekly or 28-day interval helps marketers to differentiate between what is organic and what was paid for.
People Engaged
Use this metric to discover who engaged with a page’s posts over a daily, weekly or 28 day interval.
Why track People Engaged?
Marketers rely on this metric to determine their most engaged audience segment. From there, they can tailor their content to suit this demographic better.
Facebook Insights provides a comprehensive set of analytics tools for page managers to use for free, so it’s in your best interest to check them out and get some in-depth knowledge about your page performance. Depending on your specific business goals, it’s up to you to decide which metrics are the most valuable and track them accordingly.
Looking at your Facebook Insights could be just what you need to help take your social media marketing efforts to the next level.
Measuring Facebook metrics is an essential aspect of monitoring and evaluating the performance of your social media marketing efforts. Understanding these social media metrics not only helps you gauge the effectiveness of your Facebook campaigns but also provides valuable insights into the broader landscape of social media platforms. By leveraging data from Facebook and other platforms like LinkedIn and Instagram, you can implement cross-channel marketing strategies that drive optimal results and achieve your marketing objectives.
Want to start reporting on all your Facebook data? Gather all your social media, analytics, and SEO data in the same report!

Ready to automate your reporting?
Read More

Don’t miss out!
Follow us on social media to stay tuned!
Automate your reports!
Bring all your marketing data into one automated report.
Try dashthis for free